2.4 WORKING WITH THE INSTRUMENT
The instrument is controlled by means of nine keys on the keypad. Using these keys, one can access all
available functions and change the value of all available parameters.
The instrument is equipped with the super contrast OLED colour display (320 x 240 pixels), which displays the
measurement results and the configuration menu.
The instrument has two general modes of operation: measurement performance / results preview mode and
configuration mode with the use of Menu functionality.
Turning instrument on
To turn the instrument on, press the <Alt> and <Start/Stop> keys at the same
time. The instrument goes through the self-test routine after turning on, displaying
during this time the manufacturer logo and the name of the instrument.
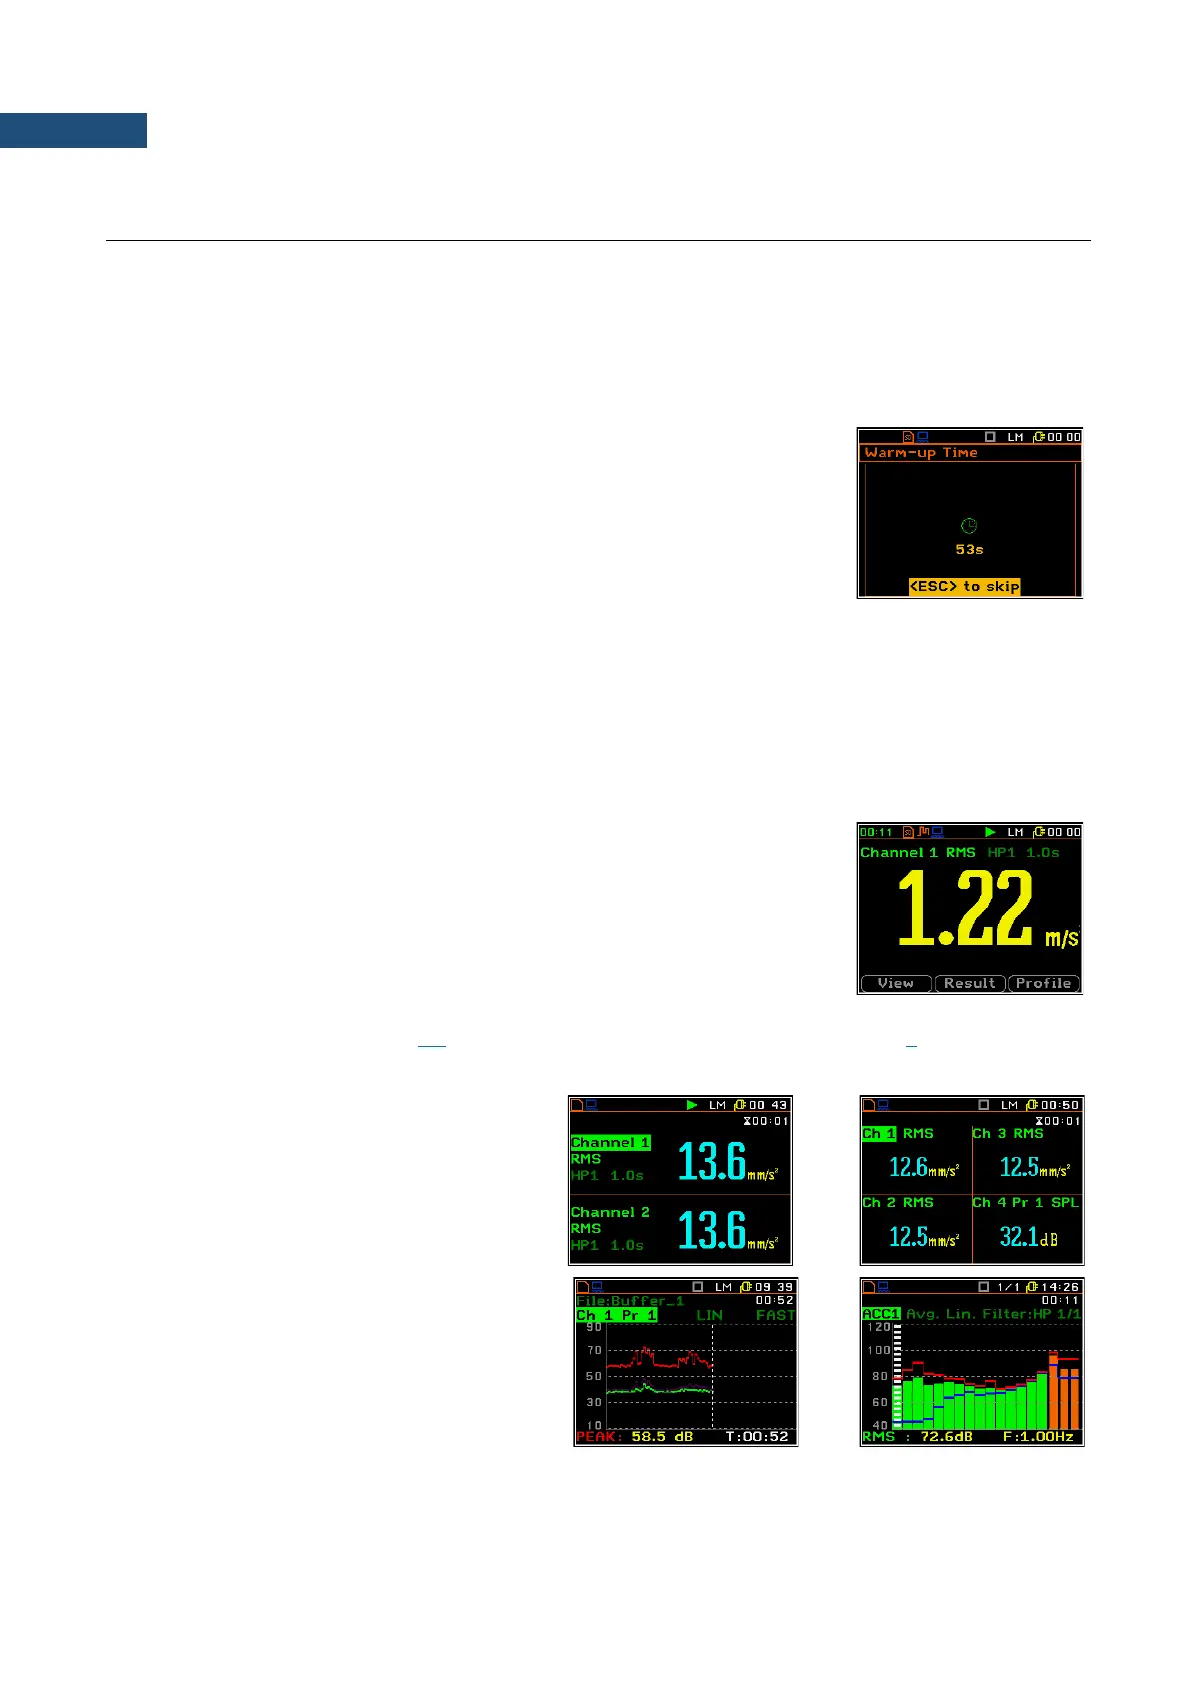
The instrument will warm up for one minute, then it enters one of the results view
mode (depending on which mode was used during the instrument’s switch off).
The measurement results can be viewed in different view modes, the set of which depend on the selected
Measurement Function and which you can change and activate/deactivate.
Measurement results viewing
Measurement results can be presented in different views, so called display modes, some of which are always
available, and some can be activated or deactivated.
Display modes present some measurement results as well as additional
information in the way of icons regarding:
• instrument status: memory, power, real time, etc.;
• measurement status: measurement function, measurement elapsed time,
measurement start/stop/pause, trigger, logger etc.;
• measurement parameters: measured result, channel and profile number,
file name, detector type, filter etc.
All icons are described in Chapter 2.6, other fields and view control functions - in Chapter 5.
Numerical results can be presented in one,
two or four channels views.
Some views present results in graphical form,
like on the right-hand example: time-history
plot and spectrum.
You can switch between views using the
▲ / ▼ keys pressed together with <Alt> or
using soft-keys.