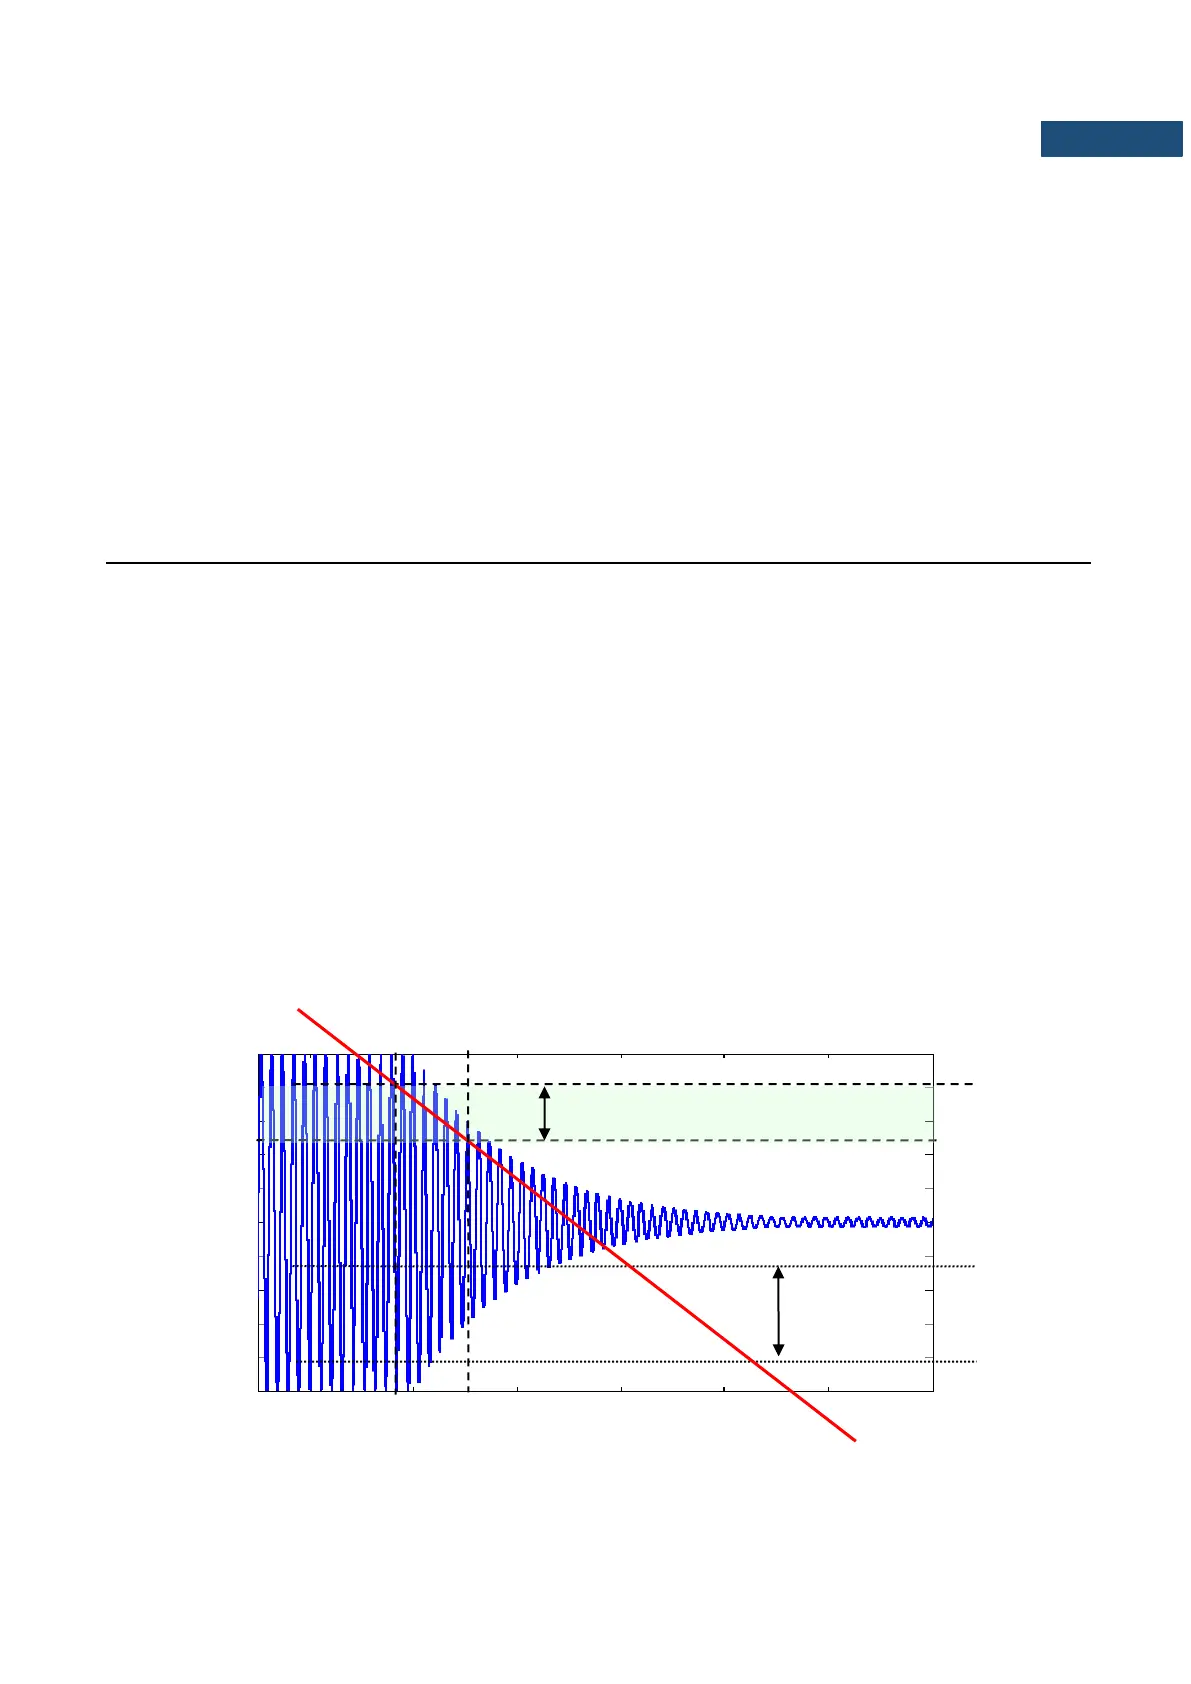
The marker t
1
indicates the moment when the sound source was switched off. From this moment the acoustic
sound pressure / acoustic power (reflected waves propagate in the room) decreases till the moment indicated
by the marker t
2
. The lower graph presents so-called the decay curve. The reverberation time value is equal
to t
2
– t
1
when the difference between sound pressure levels L
1
and L
2
is 60 dB. The 60 dB dynamic condition
is impractical in real measurements (very difficult to fulfil) hence the reverberation time (RT 60) is obtained
using the slope coefficient of the decay curve. The type of the definition from which slope coefficient is
calculated (EDT, RT 20, RT 30 or user defined) depends on the difference between levels L
1
and L
2
(the
difference between background noise level and sound source level) of the decay curve and it depends on
significantly from the acoustic source ability. If the level difference is larger than 45 dB, the RT 60 parameter
can be calculated using three definitions: EDT, RT 20 and RT 30.
The real measurement results are not as smooth as the curves presented on graphs in Figure 1. In order to
point out the interesting decay curve region (the position of the markers t
1
and t
2
) some measurement data
processing (in general signal smoothing by averaging) need to be applied.
➢ EDT (early decay time):
The EDT decay curve region is pointed out by markers t
1
and t
3
(cf. Fig. 2). It is checked whether the selected
decay curve region has proper dynamics for the EDT calculation:
L
1
– L
2
>= 10 dB
L
2
– L
3
>= noise margin
It is recommended by the ISO-3382 standard to set 10 dB value for noise margin.
In case of the impulse method, the sound pressure level values between points t
1
(with L
1
level) and t
2
(with
L
2
) are approximated with the straight line (y = a · x + b) by the linear regression. Before approximation the
EDT value is calculated using the slope coefficient ‘a’ according to the formula:
EDT = – 60.0 / a
In case of the decay method, the EDT value is calculated according to the formula:
EDT= 6 · (t
2
– t
1
)