Chapter 4 Tools
Utilities
124 WCDMA Options Version 6.20
Selecting the display mode and display properties
The numerical display is the default mode. To switch to the combined graphical/
numerical mode, push the
Graph softkey. As a result, the current versus time
display appears and the softkey description changes to “Numeric”.
Push this softkey again to return to numerical-only value.
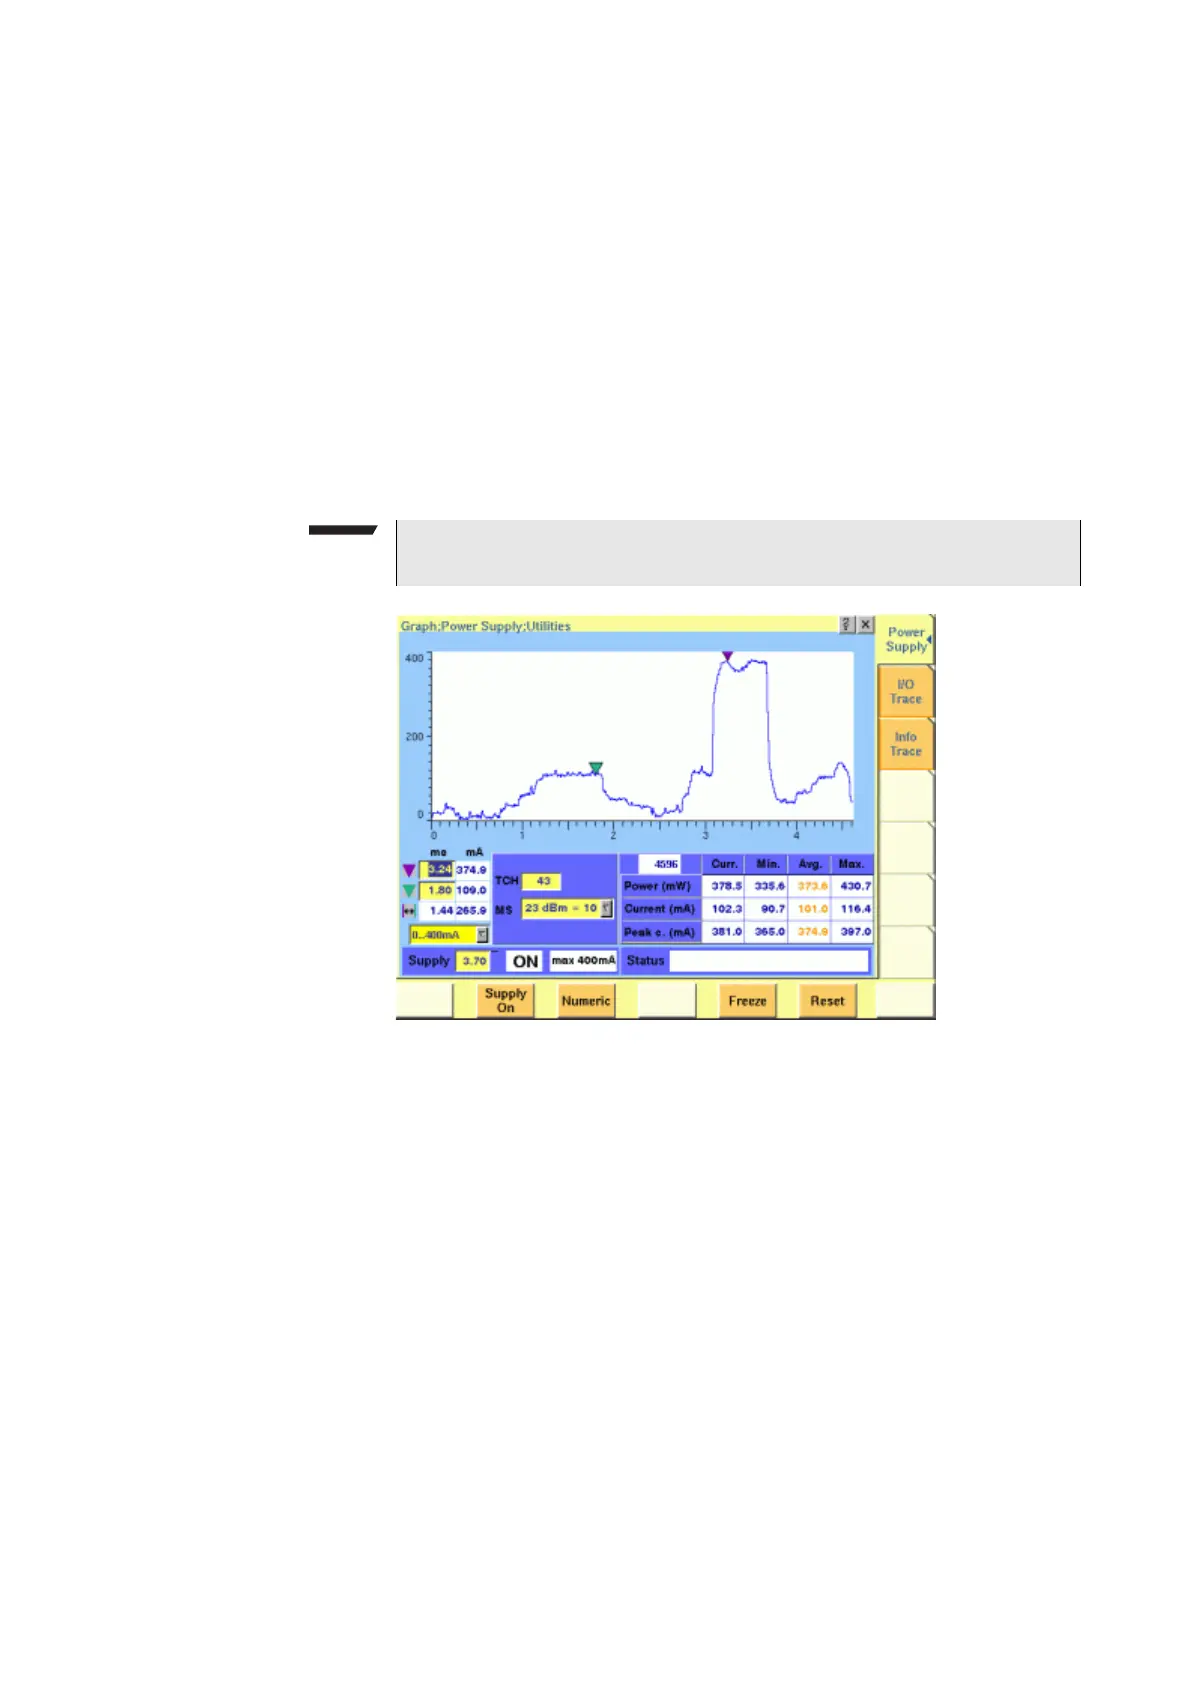
In combined graphical/numerical mode, the menu shows a graph with the
current versus time. The scale of the vertical axis is mA and the horizontal axis
scaling is in ms (milliseconds).
Two cursors and a cursor readout area allow you to read the measurement values.
The graphical display resolution can be changed as well: Use the scroll field in
the numerical results area to change the vertical resolution.
The measurement and display range covers a complete TDMA frame from the
start of a downlink frame. With a traffic channel active on time slot 3 and an
offset of three time slots between downlink and uplink, the highest current level
can be expected at (3+3) * 0.54738 ms = 3.28 ms.
Other current peaks may result from an active receive/demodulation process.
In the measurement example above, a period of low current can be identified in
the beginning. After 1 ms, the mobile phone sets up its receiver for reception of
the downlink slot. From 1.8 ms to 3 ms, the demodulated data are decoded, and
the transmitter prepares for the uplink slot. Transmission of the uplink slot
follows, requiring a lot of current from the mobile phone; the absolute value
depends on the selected uplink power level. The final phase of the frame is char-
acterized by preparations for the next uplink slot transmission, for example
interleaving in the channel coder.
Understanding result fields
The difference between current, minimum, maximum and average values is
explained in section “Statistical test evaluation” on page 42.
NOTE
The Duration field is not available in this software version.