Cleverscope CS300 Reference Manual v2.11
Page 26 www.cleverscope.com ©Cleverscope 2004-2015
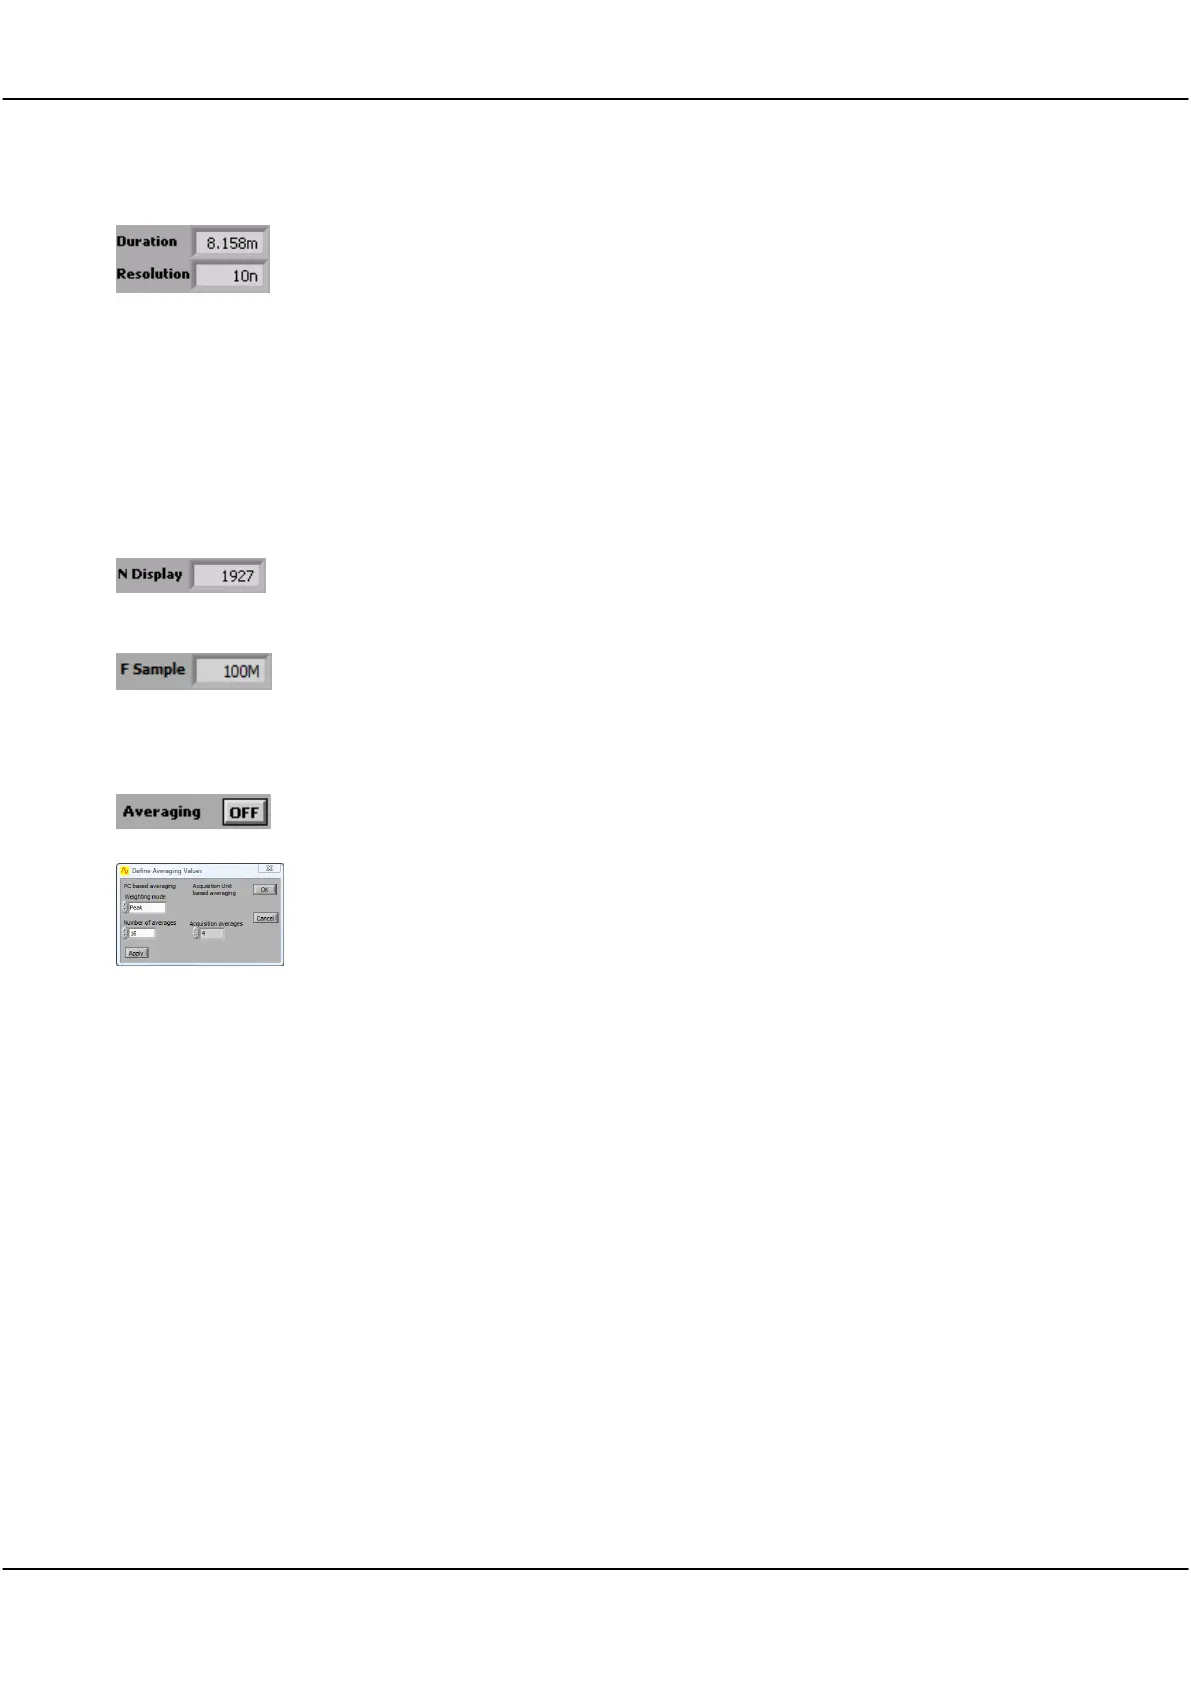
4.2.8 Duration, Resolution, N Display and F Sample
The sampling Duration is the length of time for which a continuous sequence of samples is
available for display. The time Resolution is the minimum time between samples available
for display.
Duration and the Resolution are updated after an acquisition has been completed using the
Single, Auto or Triggered buttons. The Duration is at least equal to the time width of the
Scope Display, but may be longer to make best use of the sample buffer.
Resolution is set by the number of samples available in each frame. A total of 4 or 8 million
samples divided by the number of sample frames are available. Reducing the number of
sample frames increases the number of samples available, and so will increase the time
resolution. Here the sampling duration is 8.158 ms, with a time resolution of 10ns per
sample.
N Display shows the number of samples on the display and the number of samples that
would be saved if you selected Save As from the File menu. Generally this is equal to the
value Display Samples in 5.3.6 Acquisition settings.
F Sample shows the sample capture frequency in Hertz.
The example shows 100MHz. If you use an external sample clock this will be different.
4.2.9 Averaging
Clicking the button toggles Averaging ON and OFF to arithmetically average a number
of signal frames together in the PC to reduce the effect of noise, or to see the long-term
value of a varying signal.
On the Settings menu, clicking Averaging allows control of both PC based averaging with
Weighting mode and Number of averages, and Cleverscope Acquisition Unit (CAU)
based averaging with Acquisition averages.
Refer to Methods for Displaying Signals section below for acquisition averaging using the
Waveform avg display method.
Weighting mode allows you to select one of three types of averaging: Linear, Exponential
and Peak. This is used in conjunction with Number of averages as explained below.
Linear averaging applies equal weighting over a number of signal frames, processing the
number of frames chosen in Number of averages before presenting the result.
Exponential averaging provides a moving average where a greater weighting is applied to
more recently acquired frames than older frames. The averaged frame is displayed after
every acquisition. Each new frame is scaled prior to being added to the aggregated past
signal.
The scaling is determined by the Number of averages. A large number results in a small
proportion of the new signal contributing to the average.
Peak averaging is used to accumulate maximum frequency points from the spectra of a
number of frames and is therefore only applied to data displayed in the spectrum display.
It may be used to generate a frequency response display (Gain/Phase plot).
Because noise is random, and has an average value of 0, averaging will reduce the
effective amplitude of the noise in each time sample. The amount of reduction is
dependent on Number of averages – making this number larger, will reduce the noise
more, but it will take longer to settle the signal being measured.