Dexcom G5 Mobile System User Guide
313Technical Information
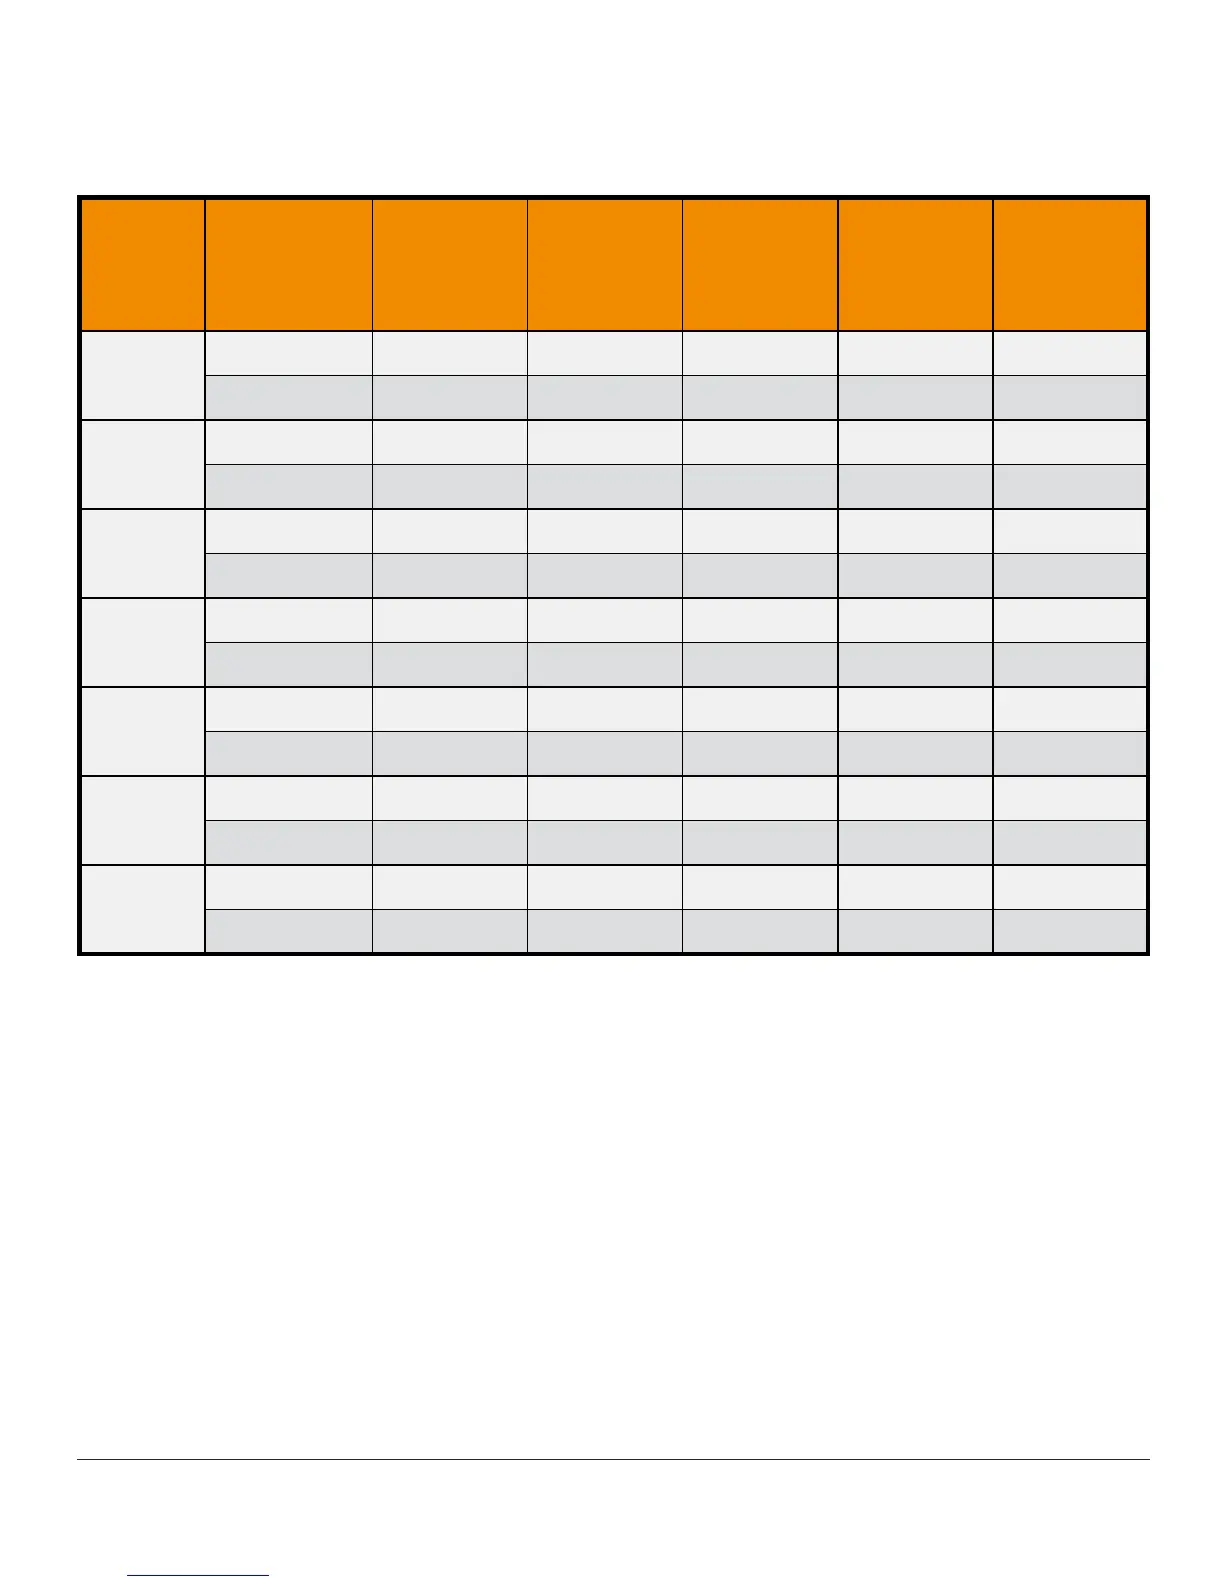
Table 4-B. System Difference to YSI Within CGM Glucose Ranges
(Pediatric)
CGM
Glucose
Range
1
(mg/dL)
Study
2
Number
of Paired
CGM-YSI
Mean
Percent
Difference
Median
Percent
Difference
Mean
Absolute
Percent
Difference
Median
Absolute
Percent
Difference
Overall
Original 2922 13.5% 11.6% 17.4% 13.5%
Software 505 2262 1.8% 1.2% 10.4% 7.9%
*40-60
Original 19 -18.1 -9.1 19.2 9.1
Software 505 86 -15.3 -13.2 16.1 13.2
*61-80
Original 76 -3.7 -2.3 13.4 10.6
Software 505 142 -4.8 -1.0 11.8 7.7
81-180
Original 1155 11.9% 9.7% 17.0% 13.0%
Software 505 805 1.9% 0.7% 10.6% 8.1%
181-300
Original 1380 14.8% 12.4% 17.4% 13.3%
Software 505 957 2.2% 1.0% 8.1% 6.5%
301-350
Original 206 19.2% 15.9% 19.4% 15.9%
Software 505 209 7.8% 6.5% 11.0% 7.9%
351-400
Original 86 18.5% 15.5% 19.1% 15.5%
Software 505 63 14.9% 11.6% 15.2% 11.6%
1
CGM readings are within 40 to 400 mg/dL, inclusive.
2
Both sets of study data are presented and are labeled as Original (SW10050) or Software
505
(SW10505).
*
For CGM ≤ 80 mg/dL, the difference and absolute difference in mg/dL are included instead of percent
differences (%).
Accuracy Relative to YSI
Accuracy between matched pairs was also estimated by calculating the percent difference between
the system reading and the YSI value. For example, if the YSI value is 100 mg/dL and the system
reading is 90 mg/dL, a 10% difference between the system and the YSI is reported. The system and
YSI values were compared by pairing the system reading that fell immediately after the YSI value
was collected.