Dexcom G5 Mobile System User Guide
336Technical Information
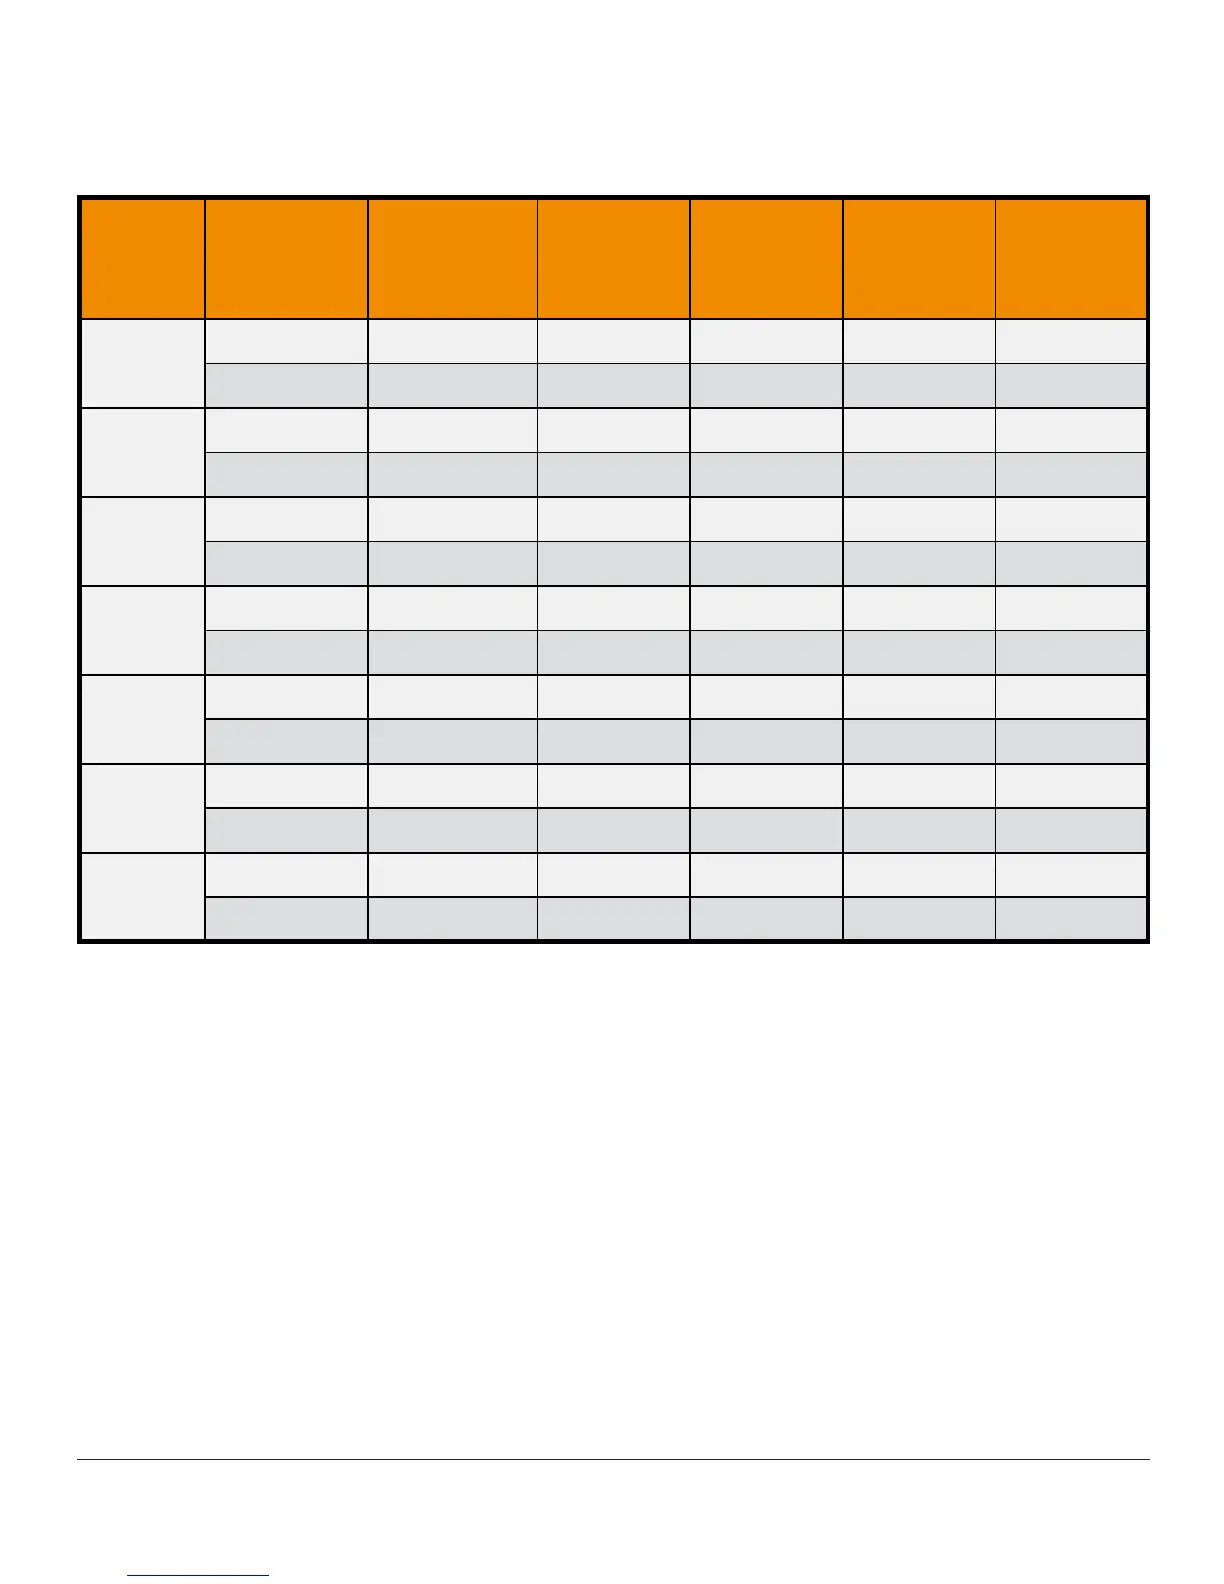
Table 12-B. System Difference to SMBG Within CGM Glucose Ranges
(Pediatric)
CGM
Glucose
Range
1
(mg/dL)
Study
2
Number
of Paired
CGM-SMBG
Mean
Percent
Difference
Median
Percent
Difference
Mean
Absolute
Percent
Difference
Median
Absolute
Percent
Difference
Overall
Original 16318 2.2% 0.9% 15.3% 11.1%
Software 505 4264 -0.7% -1.1% 12.5% 9.5%
*40-60
Original 487 -22.1 -17.0 23.9 18.0
Software 505 240 -15.9 -14.0 16.9 14.0
*61-80
Original 1340 -11.8 -8.0 17.0 11.0
Software 505 399 -7.8 -6.0 13.7 10.0
81-180
Original 7084 1.1% -1.0% 15.4% 11.4%
Software 505 1650 -1.2% -2.6% 12.1% 9.5%
181-300
Original 5627 5.7% 3.4% 13.5% 9.5%
Software 505 1526 1.7% 0.9% 10.1% 7.7%
301-350
Original 1176 9.6% 7.2% 14.2% 10.4%
Software 505 319 6.7% 5.9% 11.8% 8.9%
351-400
Original 604 12.7% 10.2% 16.1% 11.9%
Software 505 130 12.0% 8.9% 15.7% 10.6%
1
CGM readings are within 40 to 400 mg/dL, inclusive.
2
Both sets of study data are presented and are labeled as Original (SW10050) or Software
505
(SW10505).
*
For CGM ≤ 80 mg/dL, the differences in mg/dL are included instead of percent differences (%).
Agreement and Accuracy Relative to SMBG
Agreement between the system and BG values is also characterized using paired system and SMBG
results (Table 11-A/B to 12-A/B). The system and SMBG values were compared by pairing the
comparative SMBG value to a system glucose reading that occurred immediately after the SMBG was
collected. These results characterize the performance that subjects expect during real-time use of the
system in their daily diabetes management when comparing the system readings to their home BG
meter results. For readings less than or equal to 80 mg/dL, the absolute difference in mg/dL between
the two glucose results was calculated. For values greater than 80 mg/dL, the absolute percent