Dexcom G5 Mobile System User Guide
335Technical Information
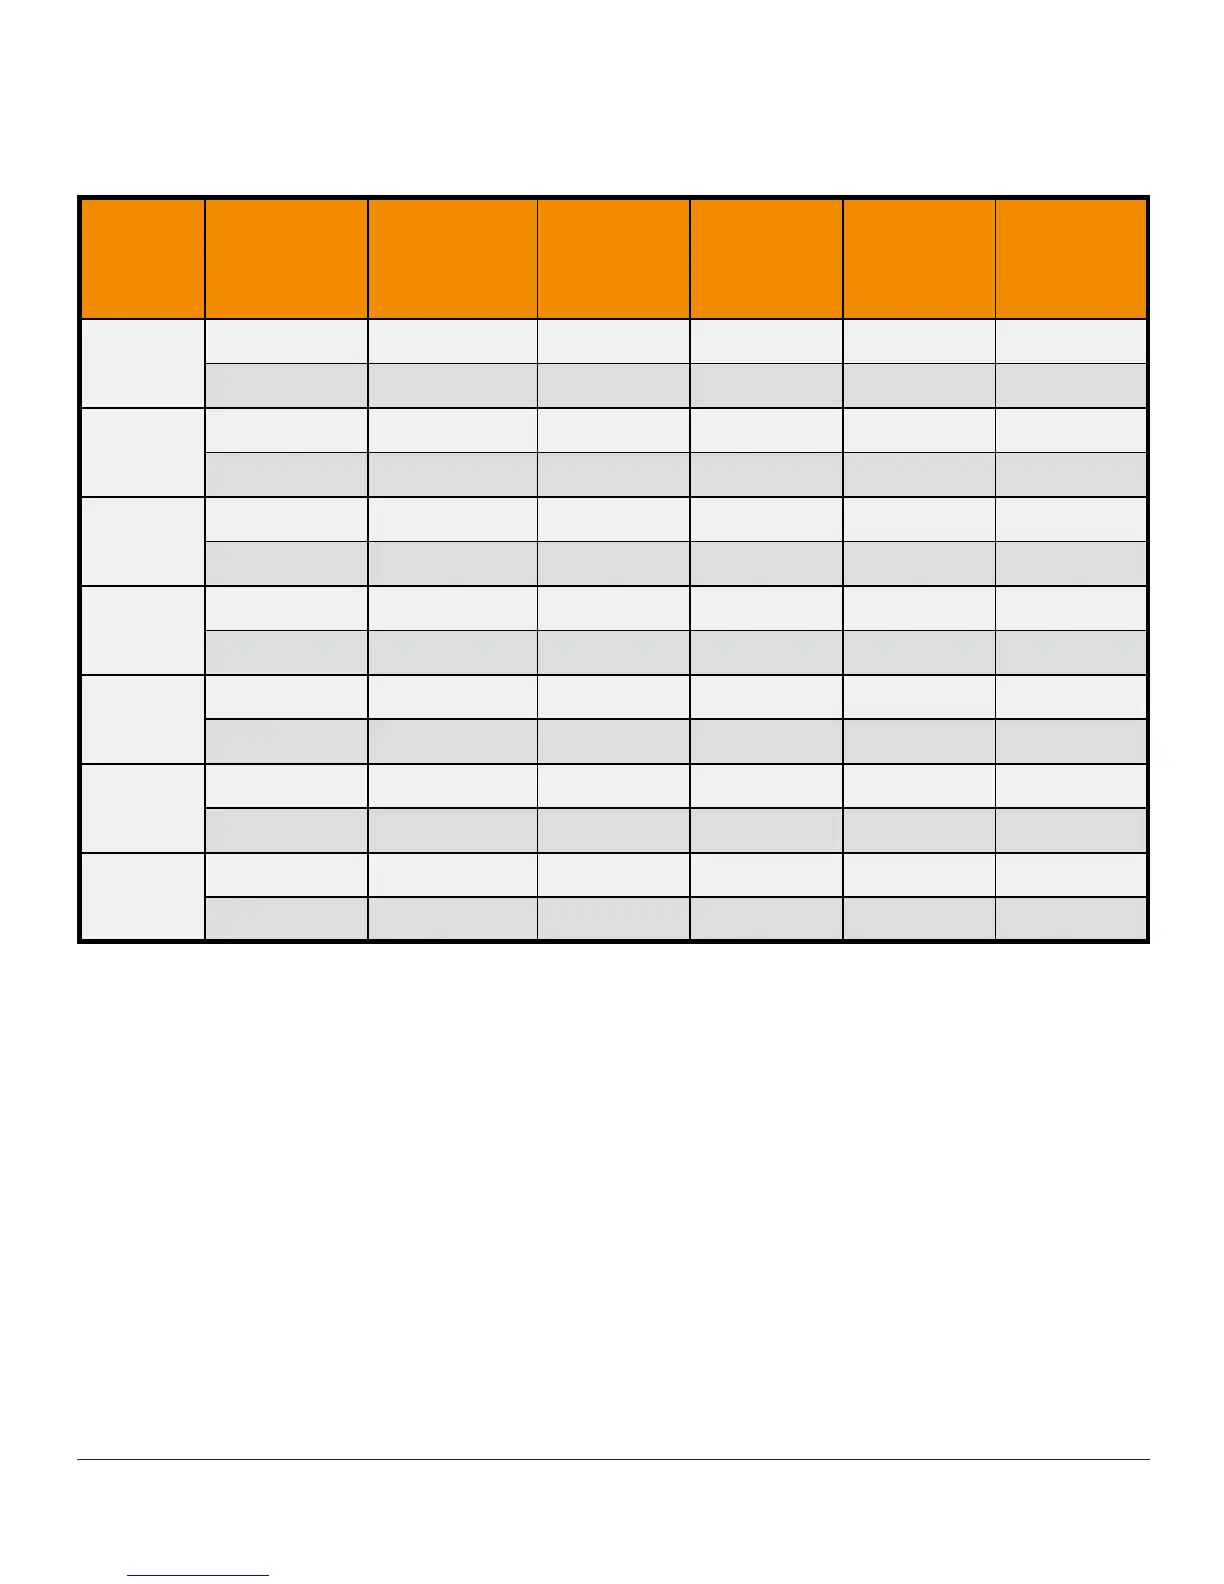
Table 12-A. System Difference to SMBG Within CGM Glucose Ranges
(Adult)
CGM
Glucose
Range
1
(mg/dL)
Study
2
Number
of Paired
CGM-SMBG
Mean
Percent
Difference
Median
Percent
Difference
Mean
Absolute
Percent
Difference
Median
Absolute
Percent
Difference
Overall
Original 7508 -0.4% -1.4% 14.0% 11.0%
Software 505 2992 -2.6% -2.7% 11.3% 8.6%
*40-60
Original 731 -9.3 -8.0 11.7 8.0
Software 505 221 -10.3 -6.0 13.0 8.0
*61-80
Original 968 -1.0 1.0 10.7 8.0
Software 505 336 -4.0 -2.0 10.1 7.0
81-180
Original 3141 1.4% 0.0% 14.2% 11.0%
Software 505 1362 -2.6% -3.1% 11.4% 8.9%
181-300
Original 1960 -0.7% -2.8% 13.0% 10.3%
Software 505 826 -1.4% -2.0% 9.5% 7.4%
301-350
Original 450 -0.7% -2.6% 10.5% 8.6%
Software 505 161 -0.0% 0.0% 8.3% 6.0%
351-400
Original 258 5.0% 3.0% 11.9% 8.6%
Software 505 86 3.9% 3.2% 8.1% 6.7%
1
CGM readings are within 40 to 400 mg/dL, inclusive.
2
Both sets of study data are presented and are labeled as Original (SW10050) or Software
505
(SW10505).
*
For CGM ≤ 80 mg/dL, the differences in mg/dL are included instead of percent differences (%).