77
HemoSphere Advanced Monitor 5 Navigating the HemoSphere Advanced Monitor
NOTE Before a thermodilution set is performed and before any values are entered (see 5.3.8.2
Parameter Boxes below)
the clock/waveform and iCO icons do not appear. Only the
available continuous parameters are displayed.
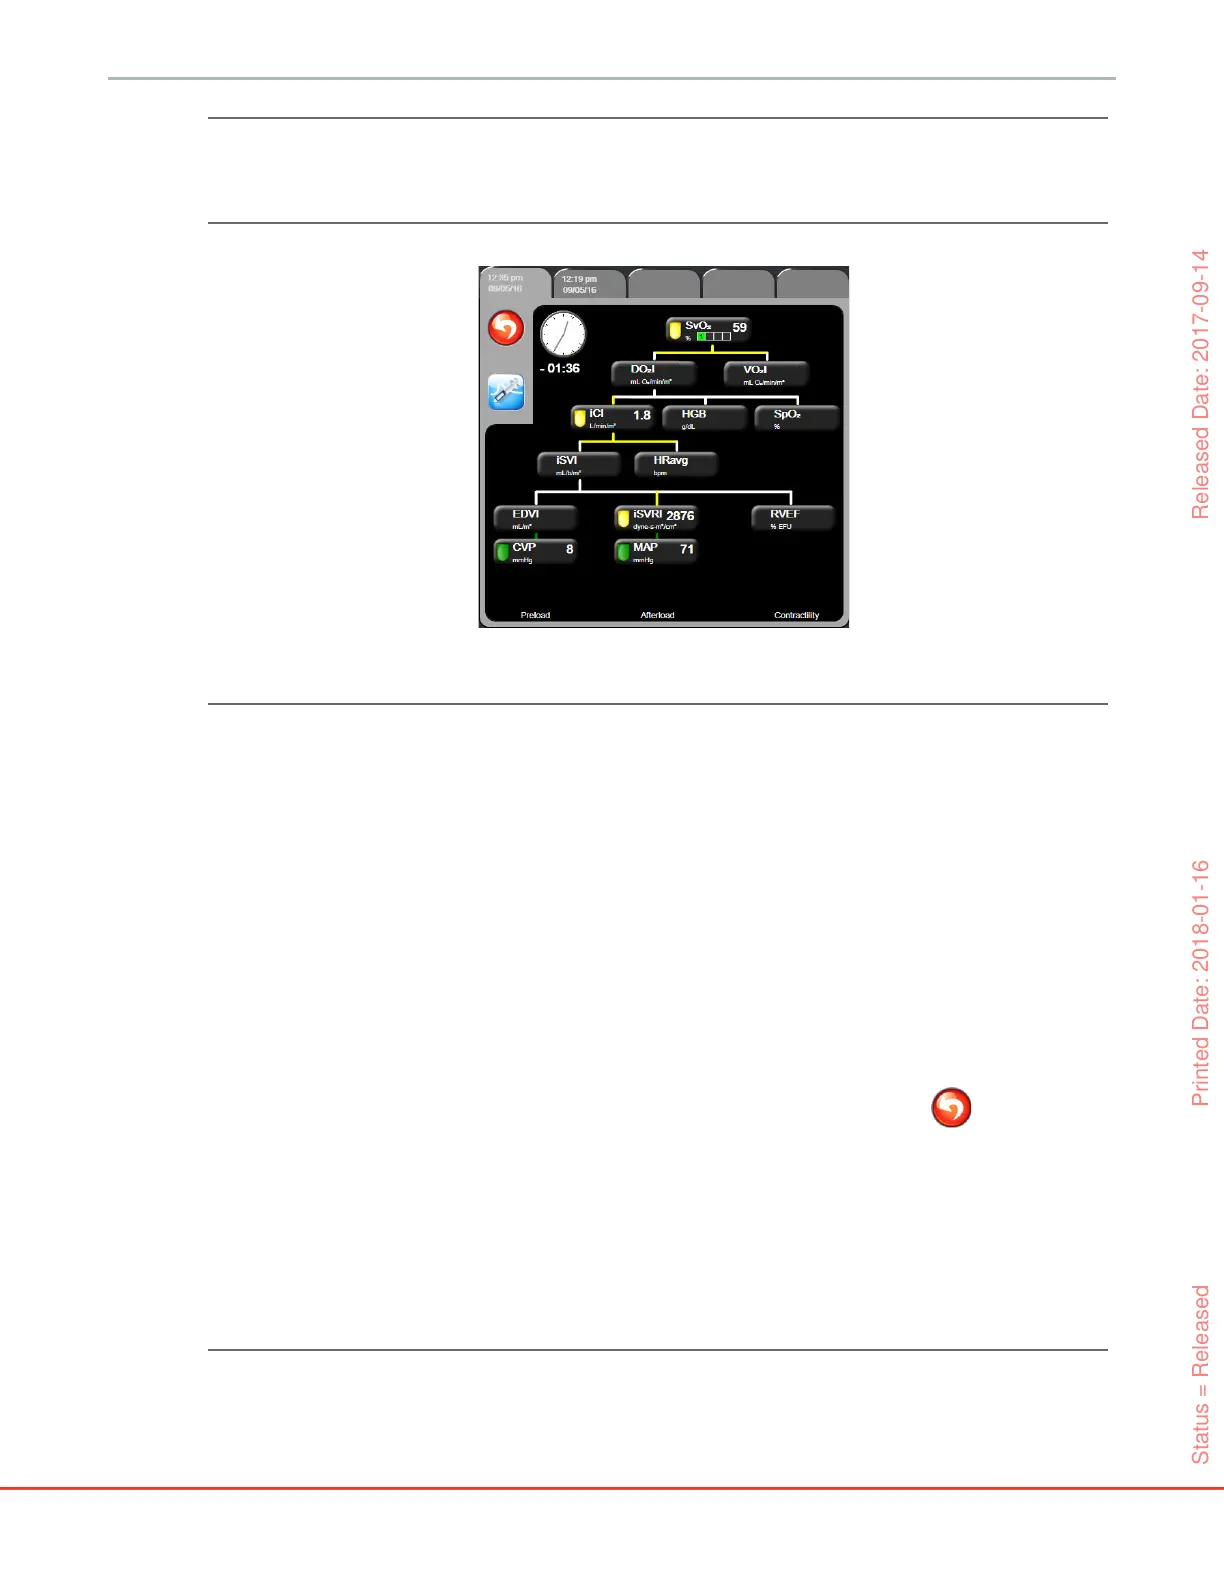
NOTE The historic physio relationship screen displays most of the parameters available on the
system at a point in time. The screen displays lines connecting the parameters,
highlighting the relationship of the parameters to each other. The historic physio
relationship screen displays the configured (1-4) key parameters on the right hand side
of the screen. There is a horizontal tab composite at the top that allows the user to
navigate through the database of historic records. The record times correspond to
thermodilution bolus sets and derived value calculations.
The historic physio relationship screen allows the user to enter parameters used to
calculate derived parameters DO
2
and VO
2
, on only the most recent record. The values
entered are for the time of the record and not the current time.
The historic physio relationship screen is accessed through the clock/waveform icon
on the continuous physio relationship screen. Touch the return icon to return to
the continuous physio relationship screen. There is no 2 minute time-out for this
screen.
To calculate DO
2
and VO
2
, the partial pressure of arterial (PaO
2
) and venous (PvO
2
)
oxygen is required. For the historic physio relationship screen, a PaO
2
and PvO
2
value
of zero (0) is used. To calculate DO
2
and VO
2
using values other than zero (0) for PaO
2
and PvO
2
, use the Derived Value Calculator (see section 5.4.4 on page 81).
Figure 5-15 Historic physio relationship data screen
Status = Released Printed Date: 2018-01-16 Released Date: 2017-09-14