HemoSphere Advanced Monitor 12 Advanced Features
165
4
Touch any selected parameter to change it to a different available parameter or touch None on
the parameter selection panel to remove it from tracking.
5 To view and select parameter/target settings from a previous GDT tracking session, touch the
Recents tab.
6 Touch OK to begin GDT tracking.
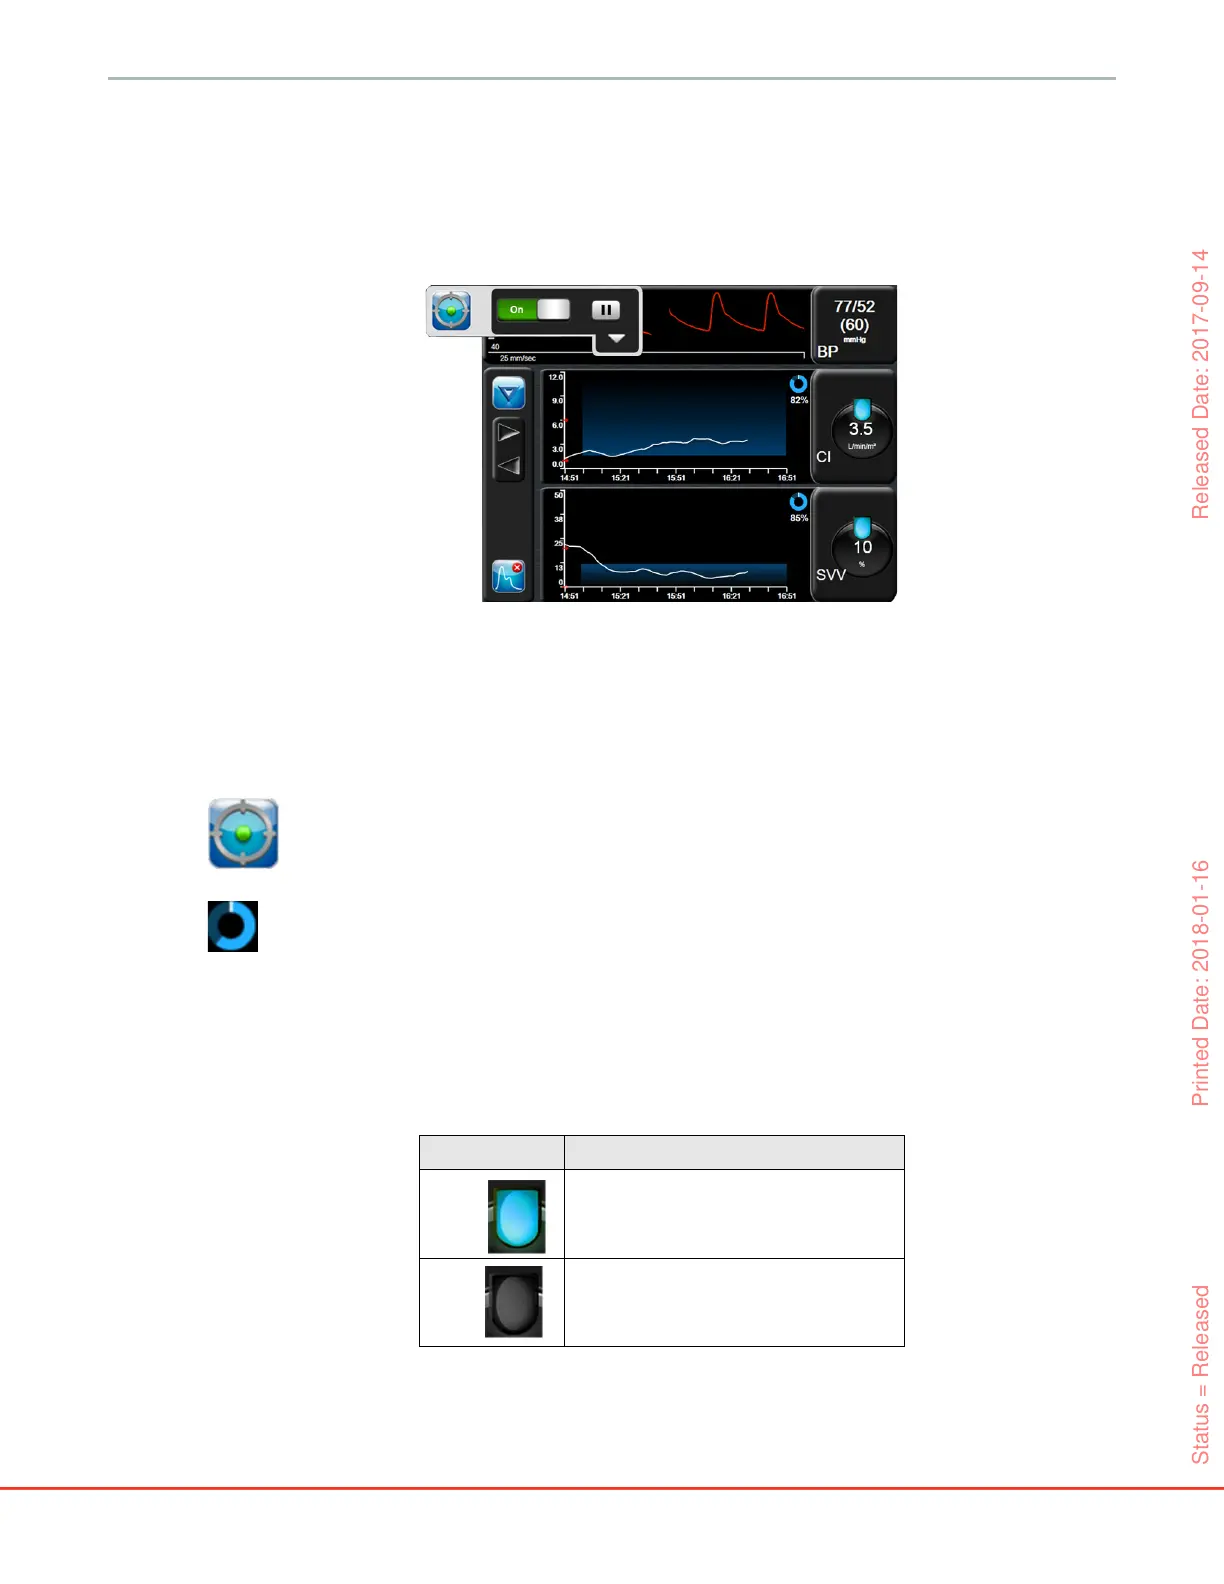
12.2.1.2 Active GDT Tracking
During active GDT tracking, the plot area of the parameter trend graph within targeted range appears shaded
in blue. See figure 12-9, “GDT Active Tracking,” on page 165.
GDT Tracking Control Panel. Touch the GDT Tracking button to pause or stop during active
tracking. While tracking is paused, the plot area within target range on the parameter graph appears
shaded in gray.
Time-In-Target Value. This is the primary output of enhanced parameter tracking. It is displayed
below the Time-In-Target icon on the upper right corner of the parameter’s graphical trend plot.
This value represents the accumulated percentage of time a parameter has been within target during
an active tracking session.
Parameter Globe Target Indicator Colors. Table 12-9 defines clinical target indicator colors during
GDT tracking.
Figure 12-9 GDT Active Tracking
Table 12-9 GDT Target Status Indicator Colors
Color Indication
Blue
Tracked parameter is currently within the
configured target range.
Black Tracked parameter is currently outside of the
configured target range.
Status = Released Printed Date: 2018-01-16 Released Date: 2017-09-14