204
HemoSphere Advanced Monitor D Monitor Settings and Defaults
NOTE The HemoSphere advanced monitor will not accept a setting of an upper scale setting
that is less than the lower scale setting. Nor will it accept a lower scale setting that is
higher than the upper scale setting.
D.3 Parameter Display and Configurable Alarm/Target Ranges
MAP mmHg 50 130 5
MPAP mmHg 0 45 5
PPV % 0 50 10
PR bpm 40 130 5
P(↓BP) % 0 100 10
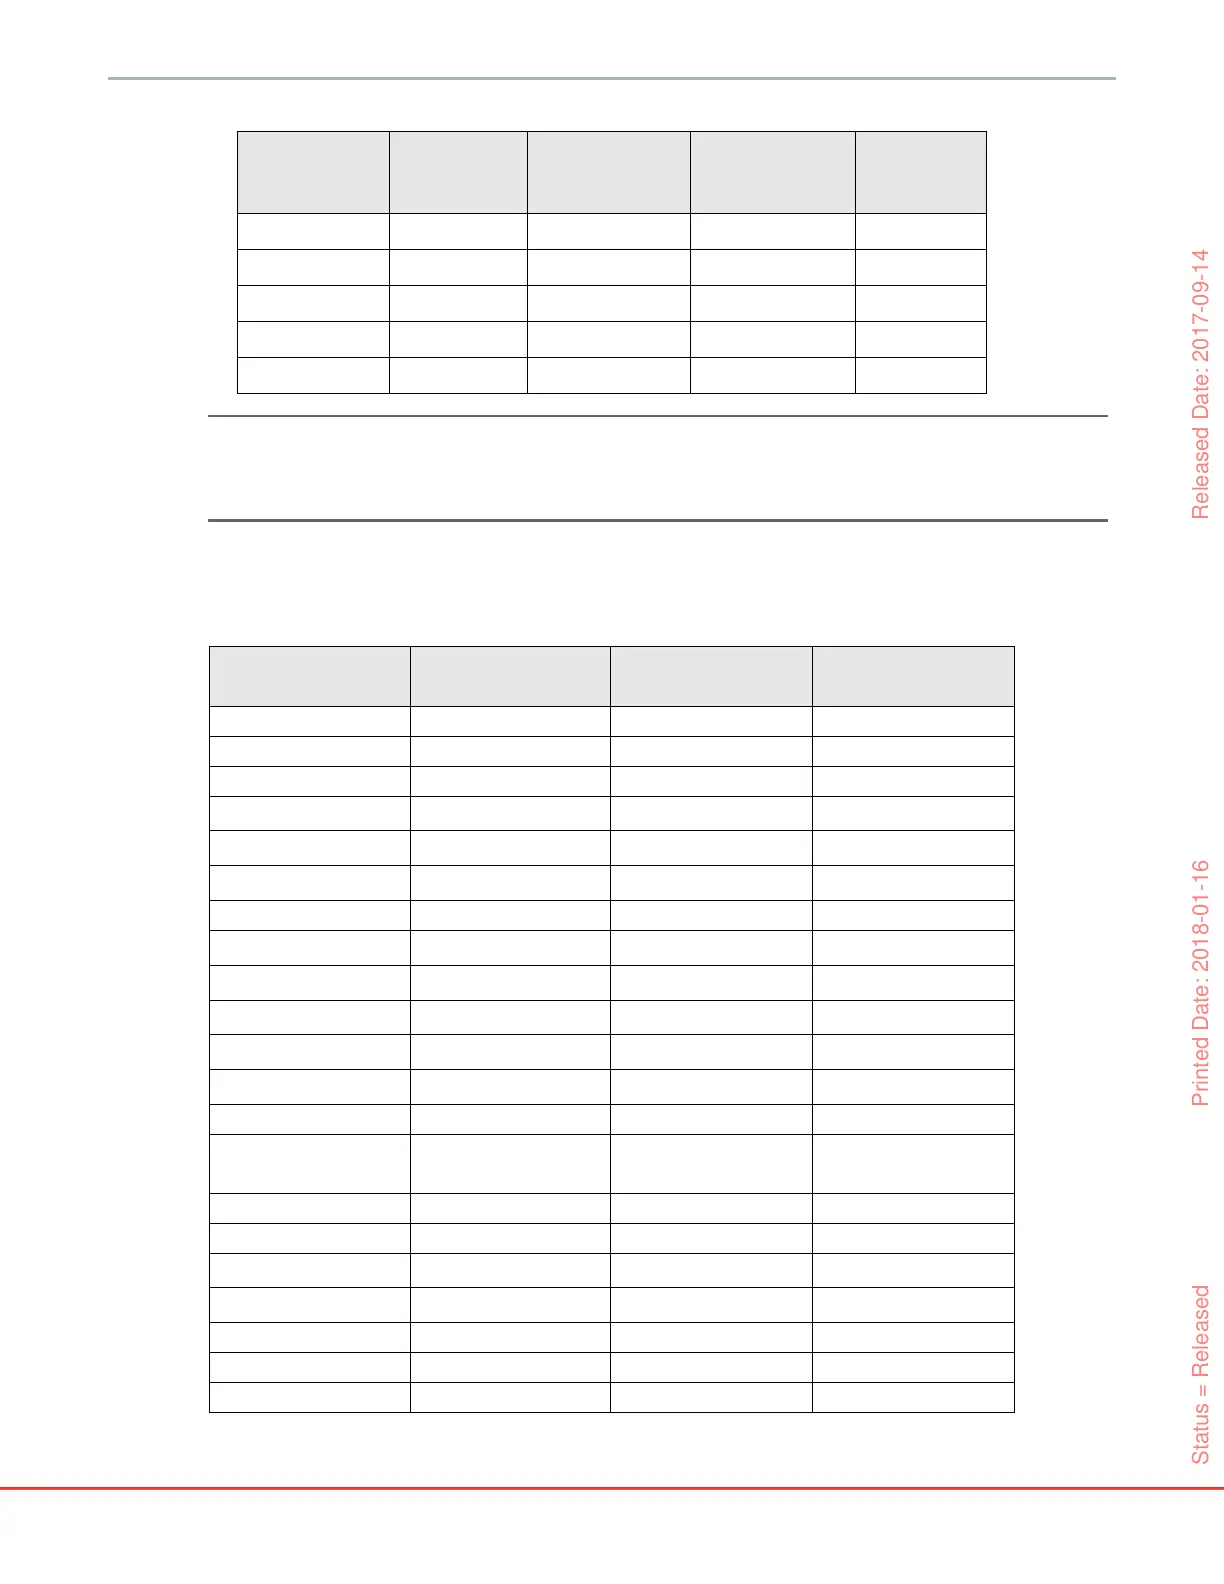
Table D-3 Configurable parameter alarm and display ranges
Parameter Units Display Range
Configurable
Range
CO L/min 1.0 to 20.0 1.0 to 20.0
iCO L/min 0.0 to 20.0 0.0 to 20.0
sCO L/min 1.0 to 20.0 1.0 to 20.0
CI
L/min/m
2
0.0 to 20.0 0.0 to 20.0
iCI
L/min/m
2
0.0 to 20.0 0.0 to 20.0
sCI
L/min/m
2
0.0 to 20.0 0.0 to 20.0
SV mL/b 0 to 300 0 to 300
SVI
mL/b/m
2
0 to 200 0 to 200
SVR
dyne-s/cm
5
0 to 5000 0 to 5000
SVRI
dyne-s-m
2
/cm
5
0 to 9950 0 to 9950
iSVR
dyne-s/cm
5
0 to 5000 0 to 5000
iSVRI
dyne-s-m
2
/cm
5
0 to 9950 0 to 9950
SVV % 0 to 99 0 to 99
Oximetry (ScvO
2
/
SvO
2
)
% 0 to 99 0 to 99
EDV mL 0 to 800 0 to 800
sEDV mL 0 to 800 0 to 800
EDVI
mL/m
2
0 to 400 0 to 400
sEDVI
mL/m
2
0 to 400 0 to 400
RVEF % 0 to 100 0 to 100
sRVEF % 0 to 100 0 to 100
CVP mmHg 0 to 50 0 to 50
Table D-2 Graphical trend parameter scale defaults
Parameter Units
Minimum
default
value
Maximum
default
value
Setting
increment
Status = Released Printed Date: 2018-01-16 Released Date: 2017-09-14