71
HemoSphere Advanced Monitor 5 Navigating the HemoSphere Advanced Monitor
6 Touch the enter icon .
5.3.2.3 Live Arterial Waveform (ART) Display
To display the real-time blood pressure waveform while in FloTrac sensor monitoring mode, touch the
display arterial waveform icon . A live arterial waveform graph panel will be displayed above the first
monitored parameter graph. A numeric reading of the beat to beat systolic, diastolic and mean arterial
pressure will be displayed above the first monitored parameter globe. To change the sweep speed (x-axis
scale) of the graph, touch the scale area and a popup menu will appear to allow input of a new sweep speed.
To stop display of live arterial waveform, touch the hide arterial waveform icon .
NOTE If there are 4 key parameters being displayed when the ART display button is touched,
display of the 4th key parameter is temporarily removed and the ART graph is placed
at the top of the remaining 3 Key Parameter trend graphs.
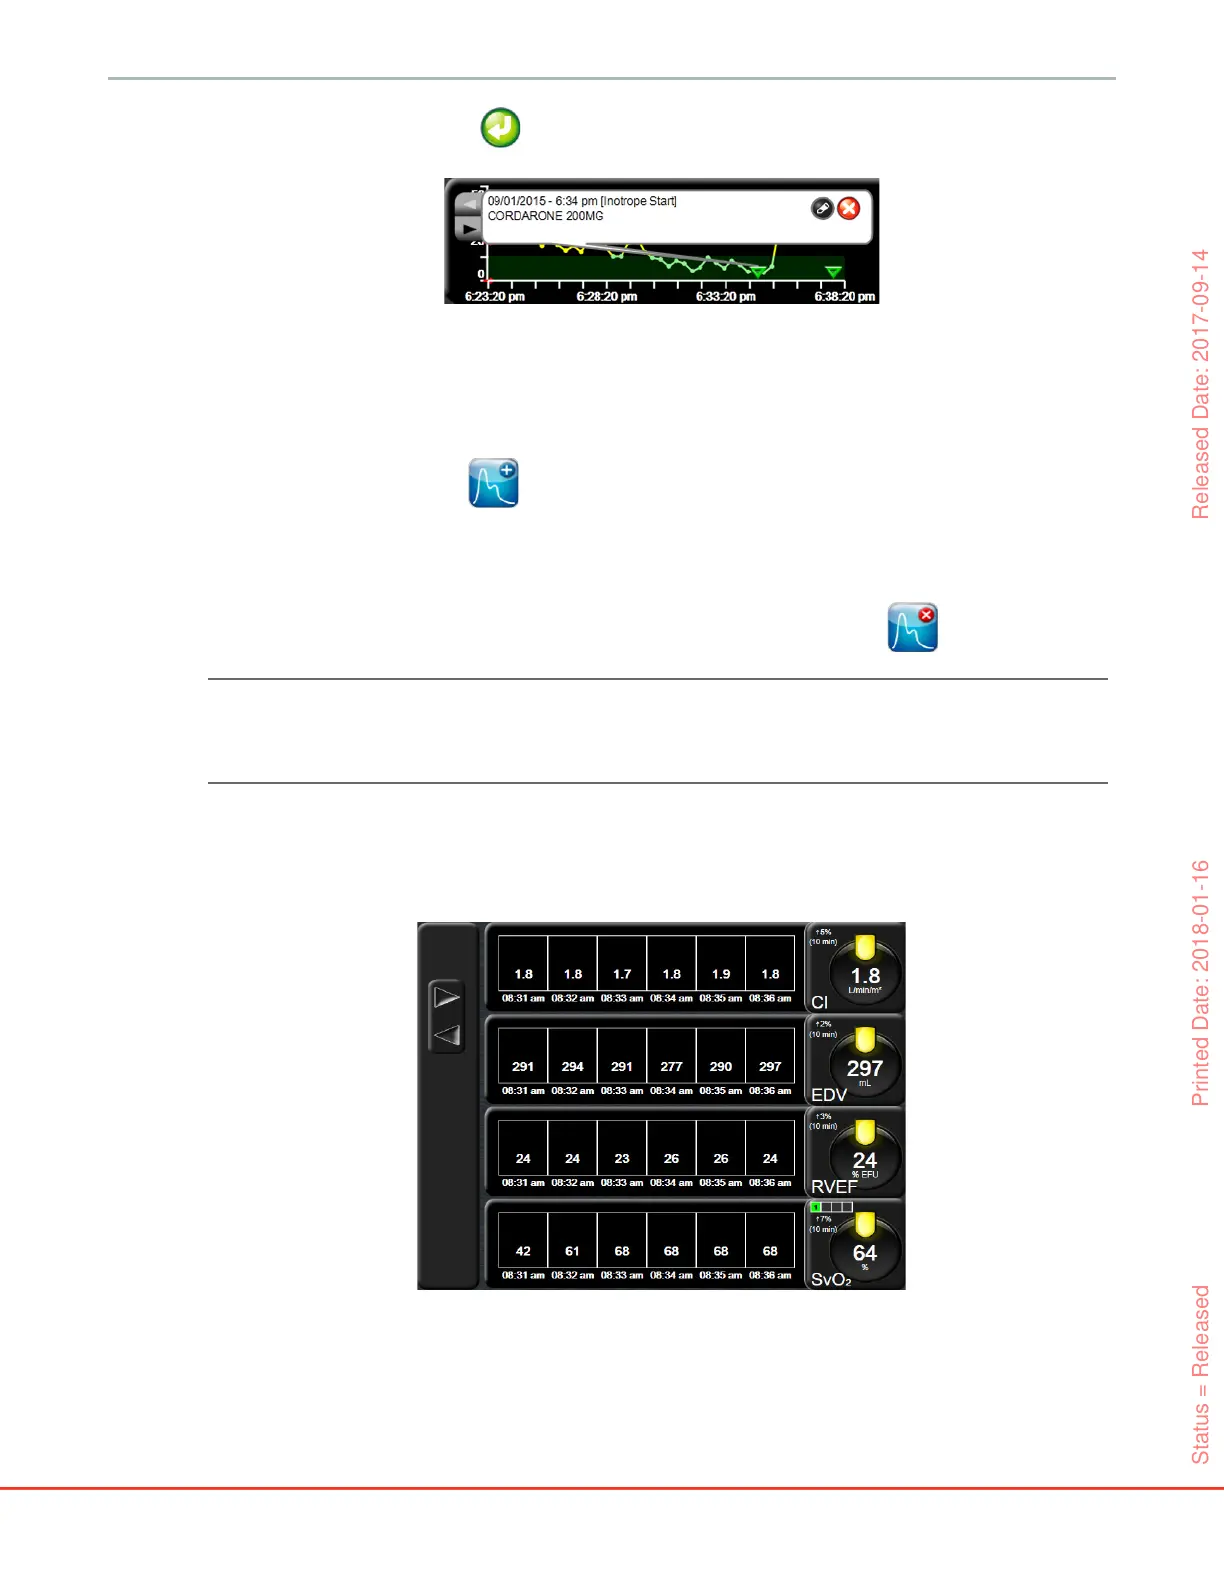
5.3.3 Tabular Trends
The tabular trends screen displays selected key parameters and their history in a tabular format.
1 To change the interval between values, touch inside the table.
Figure 5-8 Graphical trend screen - intervention information balloon
Figure 5-9 Tabular trend screen
Status = Released Printed Date: 2018-01-16 Released Date: 2017-09-14