76
HemoSphere Advanced Monitor 5 Navigating the HemoSphere Advanced Monitor
5.3.8.1 Continuous and Historical Modes
The physio relationship screen has two modes: continuous and historical. When in continuous mode, the
intermittent and derived values are always displayed as unavailable.
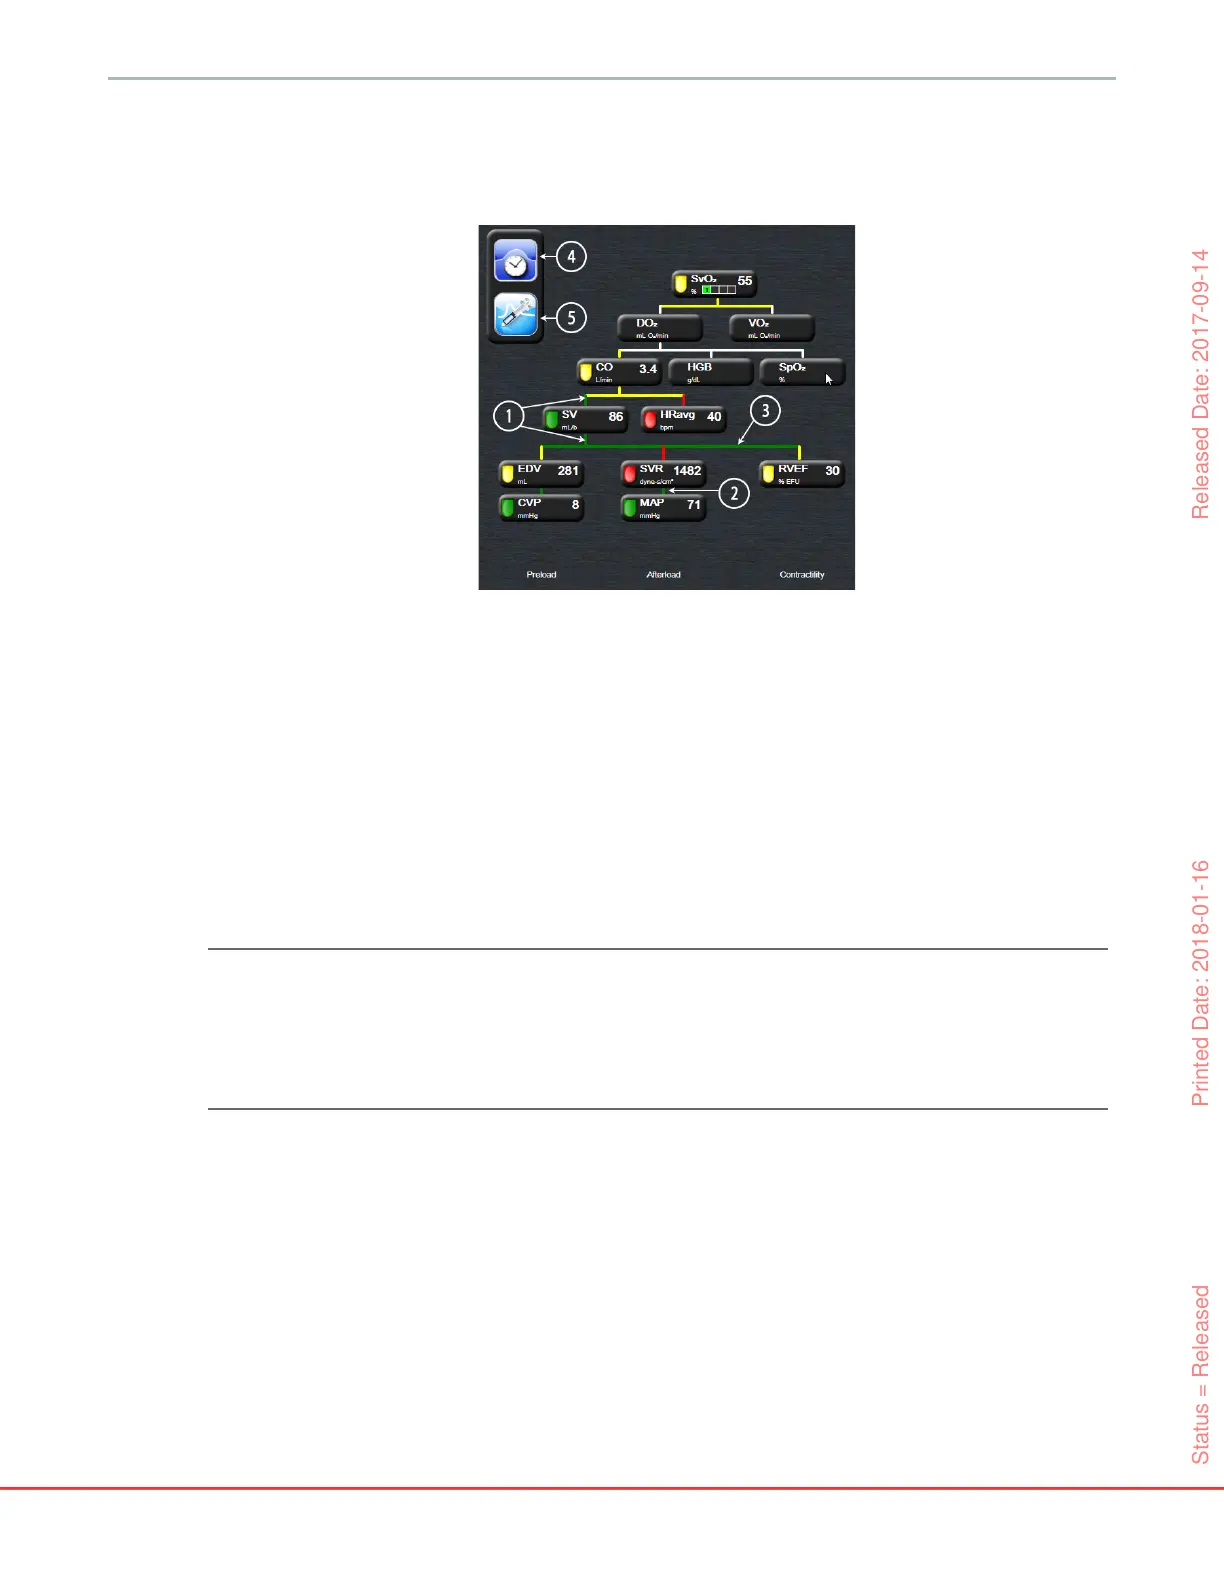
1 The vertical lines above and below the parameters appear in the same color as the parameter
lantern.
2 Vertical lines that directly connect two parameters will appear in the same color as the parameter
lantern below (for example, between SVRI and MAP in figure 5-14).
3 The horizontal lines are the same color as the line above them.
4 The left bar appears after a bolus set is performed. Touch the clock/waveform icon to display
historical data when available (see figure 5-14).
5 Touch the iCO icon, when available, to open the thermodilution new set configuration screen.
NOTE The example shown in figure 5-14 is while monitoring with a HemoSphere Swan-Ganz
module. Differences in appearance and parameters will occur with other monitoring
modes. For example, while monitoring within FloTrac sensor monitoring mode, HR
avg
is replaced by PR, PPV and SVV appear (if configured), and EDV and RVEF are not
shown.
Figure 5-14 Physio relationship screen while
monitoring with HemoSphere Swan-Ganz module
Status = Released Printed Date: 2018-01-16 Released Date: 2017-09-14