79
HemoSphere Advanced Monitor 5 Navigating the HemoSphere Advanced Monitor
5.3.9 Goal Positioning Screen
The Goal Positioning Screen allows the user to monitor and track the relationship of two key parameters by
plotting them against each other on an XY plane. This screen feature is available through the advanced setup
menu, which is passcode protected. Please contact your local Edwards Representative for more information
on enabling this advanced feature.
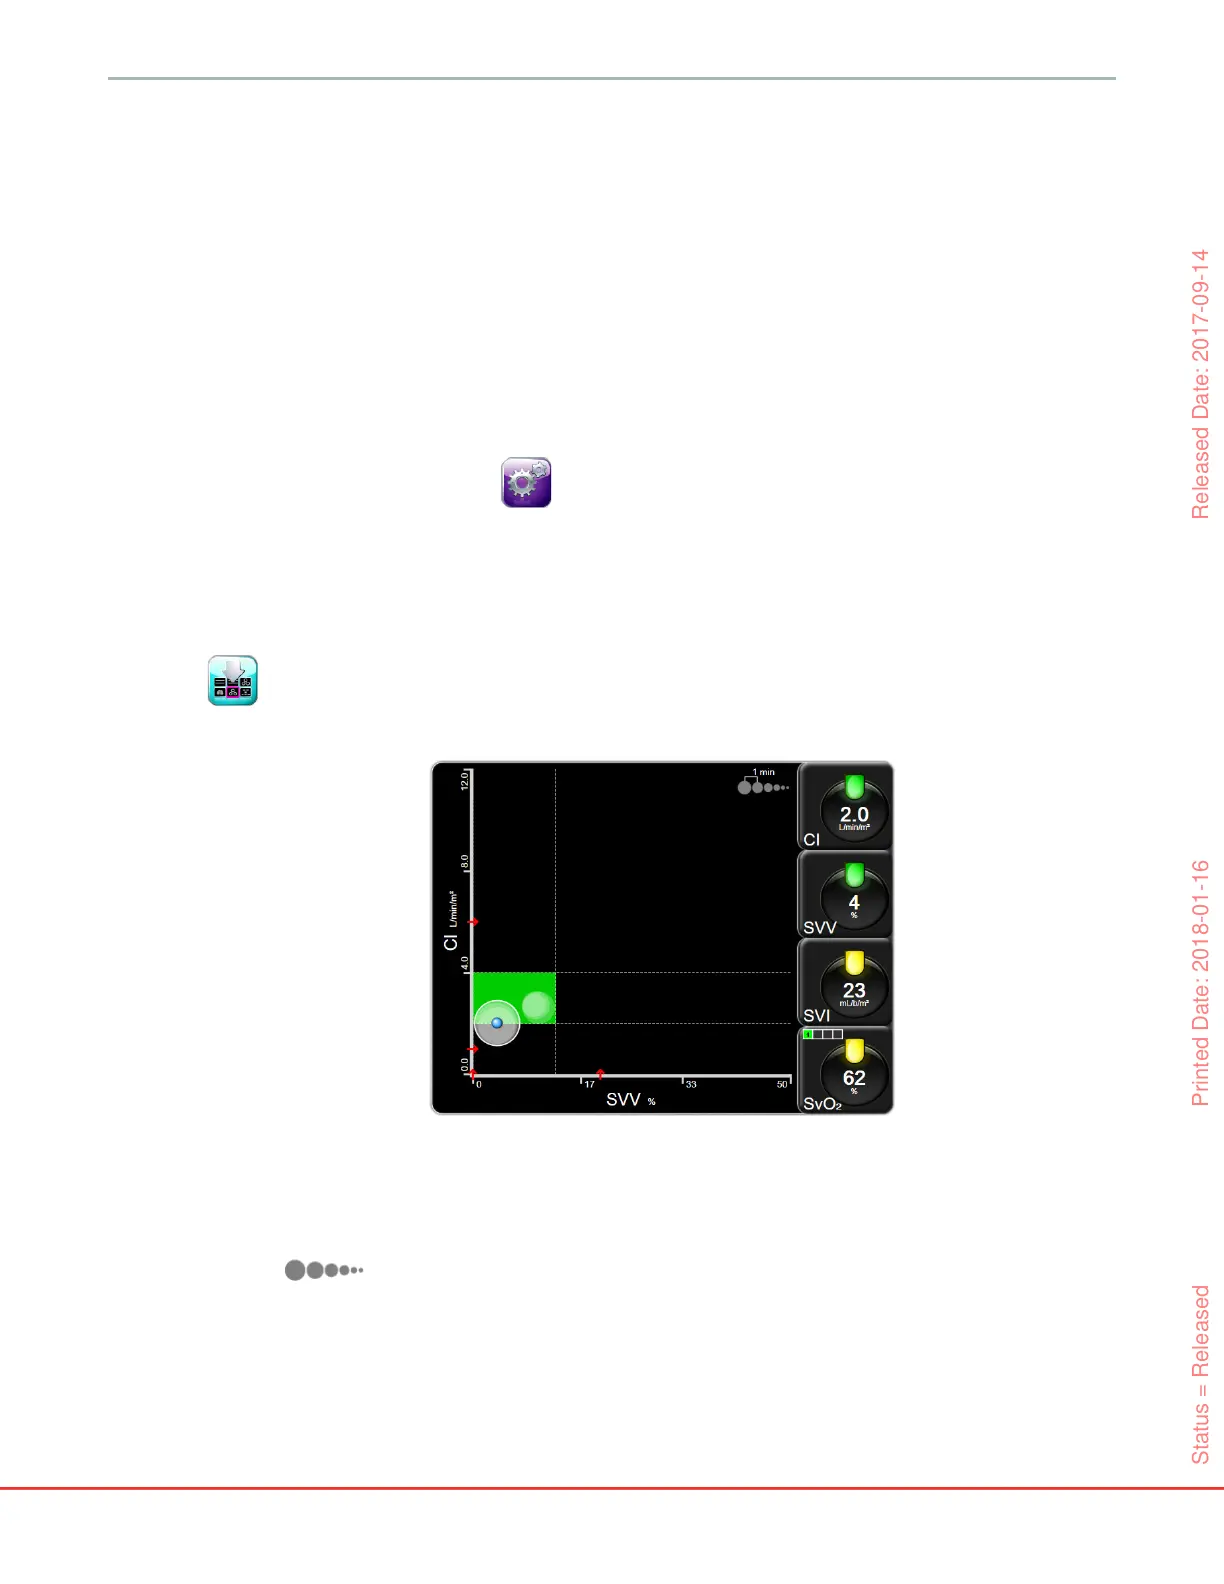
A single, pulsating blue dot represents the intersection of the two parameters and moves in real time as
parameter values change. The additional circles represent the historical parameter trend with the smaller
circles indicating older data.
The green target box represents the intersection of the green parameter target zone. The red arrows on the
X and Y axis represent the parameter alarm limits.
If not activated, the user must first enable the screen via the Advanced Setup menu.
1 Touch the settings icon .
2 Touch Advanced Setup button and enter the required password.
3 Touch the Goal Positioning button.
4 Switch the Goal Positioning toggle button to Enabled.
Once the screen is enabled, the goal positioning screen can be accessed via the monitor screen selection icon
similar to other monitoring screen views. The first two key parameters selected represent the
parameter values plotted on the y and x-axis respectively, as shown in figure 5-18.
The following adjustments can be made on this screen:
• To adjust the time interval between the historical trend circles, touch the trend interval icon
displayed on the screen.
• Continue touching the trend interval icon until Off appears to turn off historical trend circles.
• To adjust the scale of the X or Y axis, touch along the corresponding axis.
• If the current intersection of parameters moves outside the scale of the X/Y plane, a message will
appear indicating this to the user.
Figure 5-18 Goal positioning screen
Status = Released Printed Date: 2018-01-16 Released Date: 2017-09-14