69
HemoSphere Advanced Monitor 5 Navigating the HemoSphere Advanced Monitor
5.3.2.1 Graphical Trend Scroll Mode
Up to 72 hours of monitored parameter data can be viewed by scrolling back. The date appears above the
parameter data during scrolling. Two dates will appear when appropriate. To start scrolling, touch the
appropriate scroll mode button. Keep touching the scroll mode button to increase the scroll speed. The
screen will return to live mode two minutes after the scroll button has been touched, or if the back button
is touched. The scroll rate will appear below the scroll buttons.
While in scroll mode the user can scroll to data older than the current time scale displays.
NOTE It is not possible to touch past the most recent data or before the oldest data. The graph
will scroll only as far as data is available.
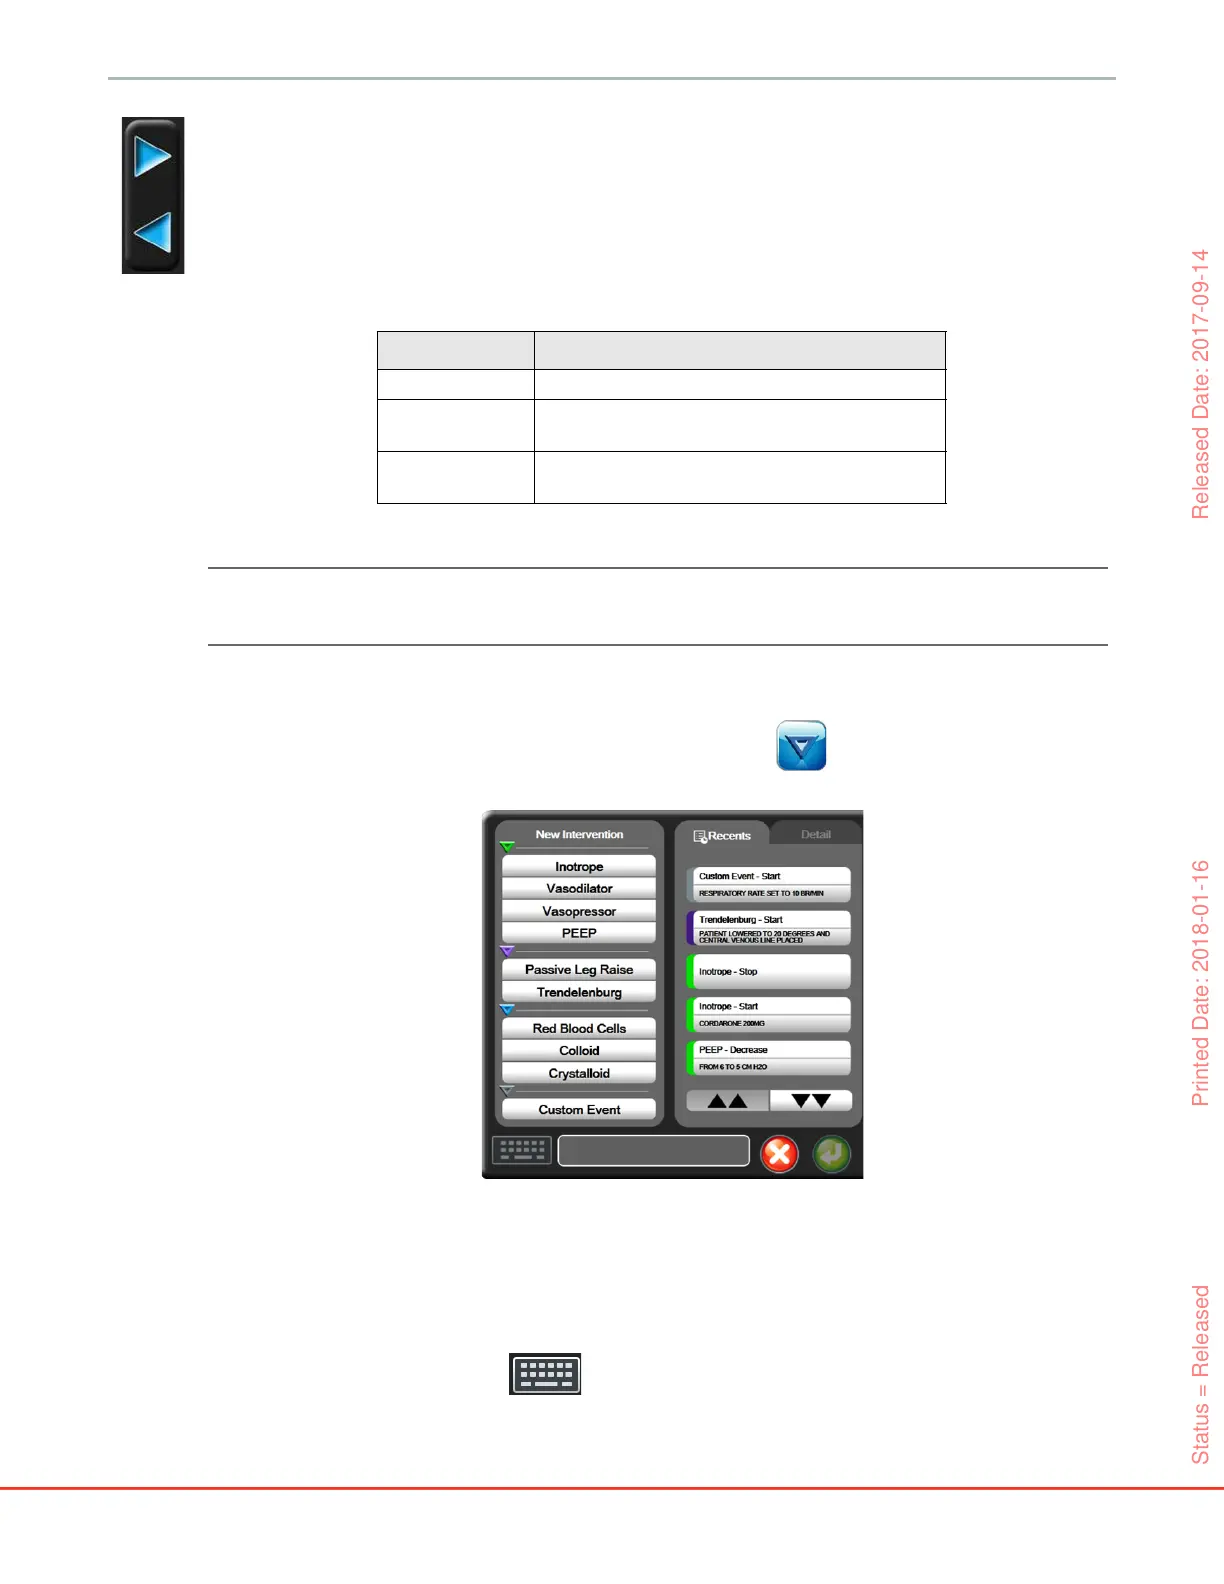
5.3.2.2 Intervention Events
While in the graphical trend screen, selecting the intervention icon provides a menu of intervention
types, details and a notes section.
To enter a New Intervention:
1 Select the Intervention type from the New Intervention menu on left.
2 Select Detail from right menu tab. Unspecified is set as a default.
3 Select the keyboard icon to enter notes (optional).
Table 5-1 Graphical trend scroll rates
Scroll setting Description
>>> Scrolls at two times the current time scale
>> Scrolls at the current time scale (one graph
width)
> Scrolls at half the current time scale (one-half
graph width)
Figure 5-7 Graphical trend- intervention window
Status = Released Printed Date: 2018-01-16 Released Date: 2017-09-14