75
HemoSphere Advanced Monitor 5 Navigating the HemoSphere Advanced Monitor
5.3.6.2 Historic Physiology Screen
The historic physiology screen displays both intermittent bolus data and a snapshot of continuous data
overlaid on a visual representation of the heart and circulatory system. The circulatory system has several
variations to illustrate the patient’s condition at the time of the bolus set — for example, the vessels constrict.
Up to 36 historic physiology records may be viewed via the horizontal tabs composite along the top of the
screen.
5.3.7 Cockpit Screen
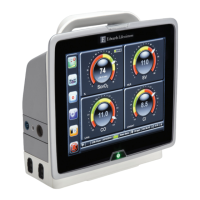
This monitoring screen, shown in figure 5-13, displays large parameter globes with the values of the
parameter being monitored. Cockpit parameter globes graphically indicate alarm/target ranges and values,
and utilize needle indicators to show where the current parameter value falls. Similar to standard parameter
globes, the value within the globe will flash when the parameter is alarming.
The key parameter globes shown on the cockpit screen display a more complex target and alarm indicator
than the standard parameter globe. The full display range of the parameter is used to create a gauge from the
graphical trends minimum to maximum settings. A needle is used to indicate the current value on the circular
gauge scale. When target ranges are enabled, red (alarm zone), yellow (warning target zone), and green
(acceptable target zone) are used to indicate the target and alarm regions within the circular gauge. When
target ranges are not enabled, the circular gauge area is all gray in color and target or alarm indicators are
removed. The value indicator arrow changes to indicate when the values are out of the gauge scale limits.
5.3.8 Physio Relationship
The physio relationship screen depicts the balance between oxygen delivery (DO
2
) and oxygen consumption
(VO
2
). It automatically updates as parameter values change so the values are always current. The connecting
lines highlight the relationship of the parameters to each other.
Figure 5-13 Cockpit monitoring screen
Status = Released Printed Date: 2018-01-16 Released Date: 2017-09-14

 Loading...