68
HemoSphere Advanced Monitor 5 Navigating the HemoSphere Advanced Monitor
NOTE When using the Acumen Hypotension Probability Indicator parameter, P(↓BP), the
patient status indicators differ from those described. Refer to Acumen Hypotension Proba-
bility Indicator Software Feature on page 150 for the patient status indicators available when
using the Acumen Hypotension Probability Indicator feature.
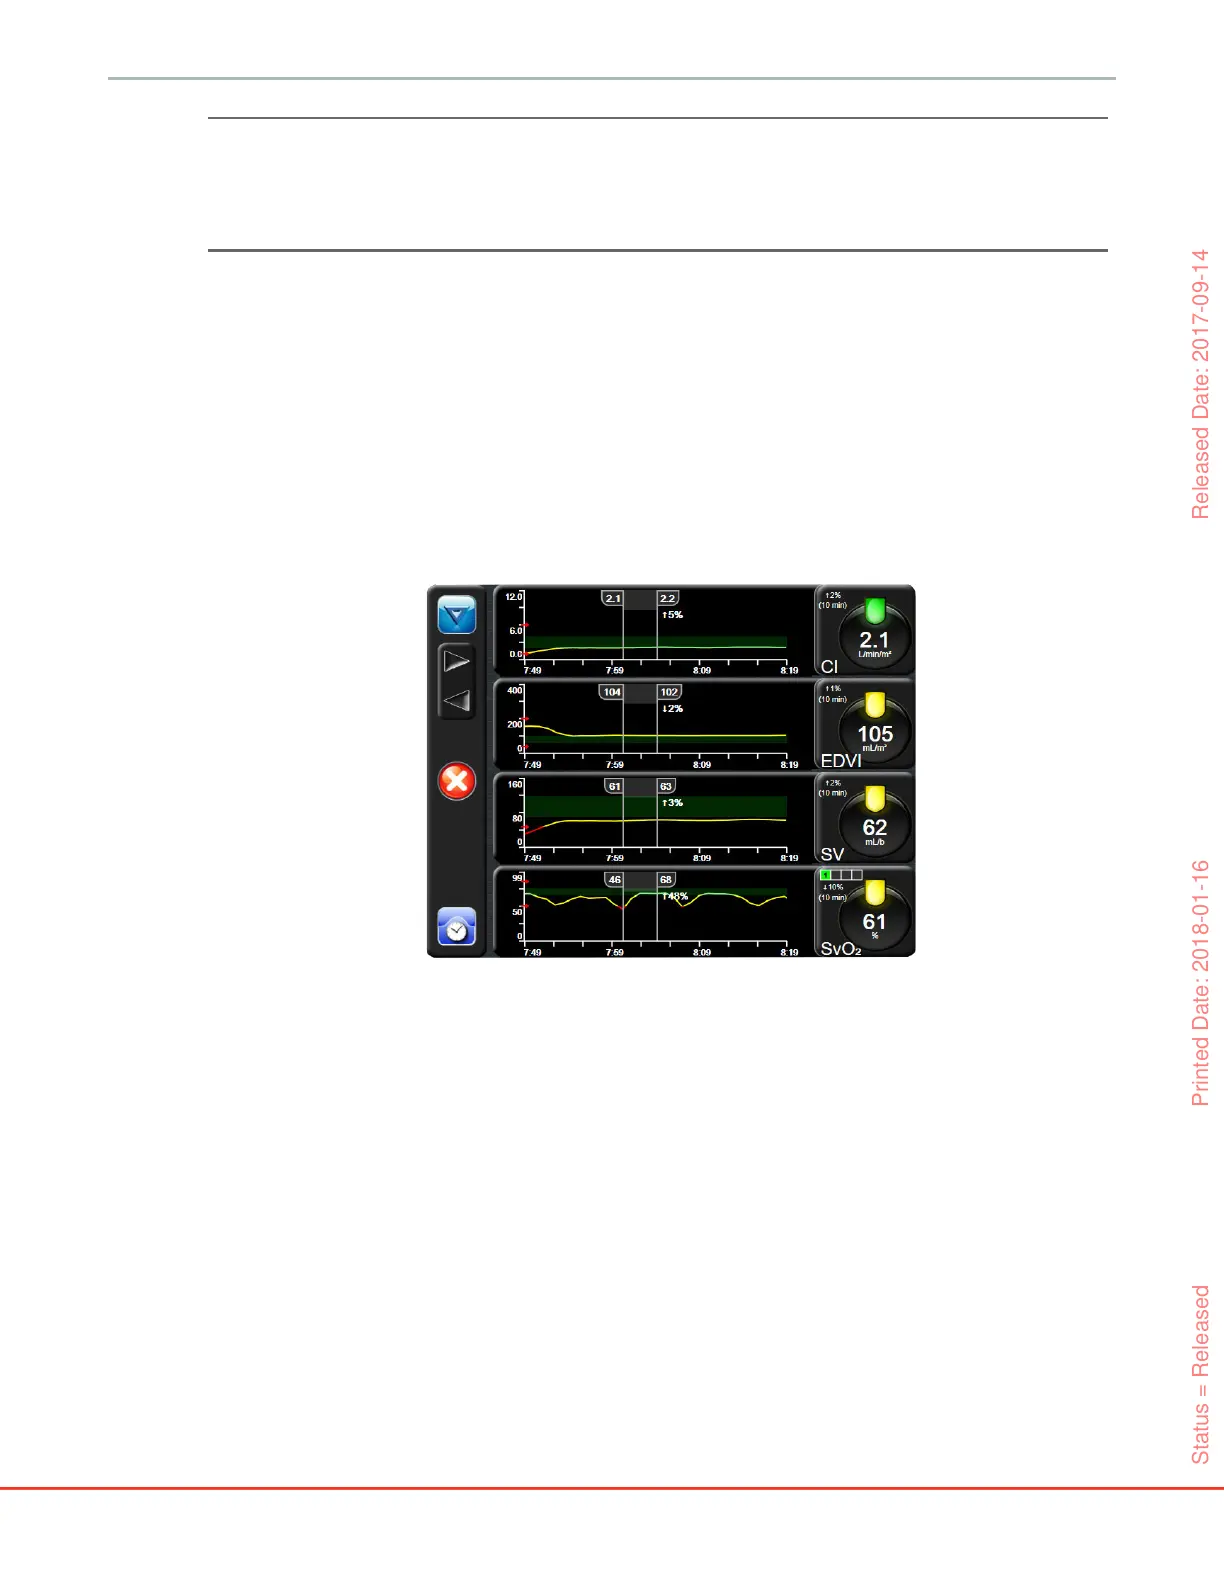
5.3.2 Graphical Trend Monitoring View
The graphical trend screen displays the current status and history of monitored parameters. The amount of
history shown for monitored parameters can be configured by adjusting the time scale.
When the target range for the parameter is enabled, the graph color codes the plot line, green indicating
within the target range, yellow indicating the value is outside the target range but within the physiological
alarm range, and red indicating the value is outside the alarm range. When the target range is disabled for
the parameter the plot line is white. The colors match those of the clinical target indicator (lantern) on the
key parameter globes in the graphical trend graph when targets are enabled for the parameter. The alarm
limits for each parameter are displayed as colored arrows on the graph y-axis.
To change the time scale of a displayed parameter, touch outside of the plot area along the x or y-axis, and a
scale popup menu will appear. Touch the value side of the Graphical Trend Time button to select a
different time period.
Figure 5-6 Graphical trend screen
Status = Released Printed Date: 2018-01-16 Released Date: 2017-09-14