73
HemoSphere Advanced Monitor 5 Navigating the HemoSphere Advanced Monitor
If two key parameters are selected, the first key parameter is displayed in graphical trend format, and the
second in tabular trend format. Key parameters can be changed by touching the parameter label located on
the parameter globe. If more than two key parameters are selected, the first two parameters are displayed in
graphical trend format, and the third and fourth — if a fourth is selected — are displayed in tabular trend
format. The time scale for data displayed on any key parameter graphical trend view(s) is independent of the
time scale displayed on the tabular trend view(s). For more information on the graphical trend view see
Graphical Trend Monitoring View on page 68. For more on tabular trend view, see Tabular Trends on page 71.
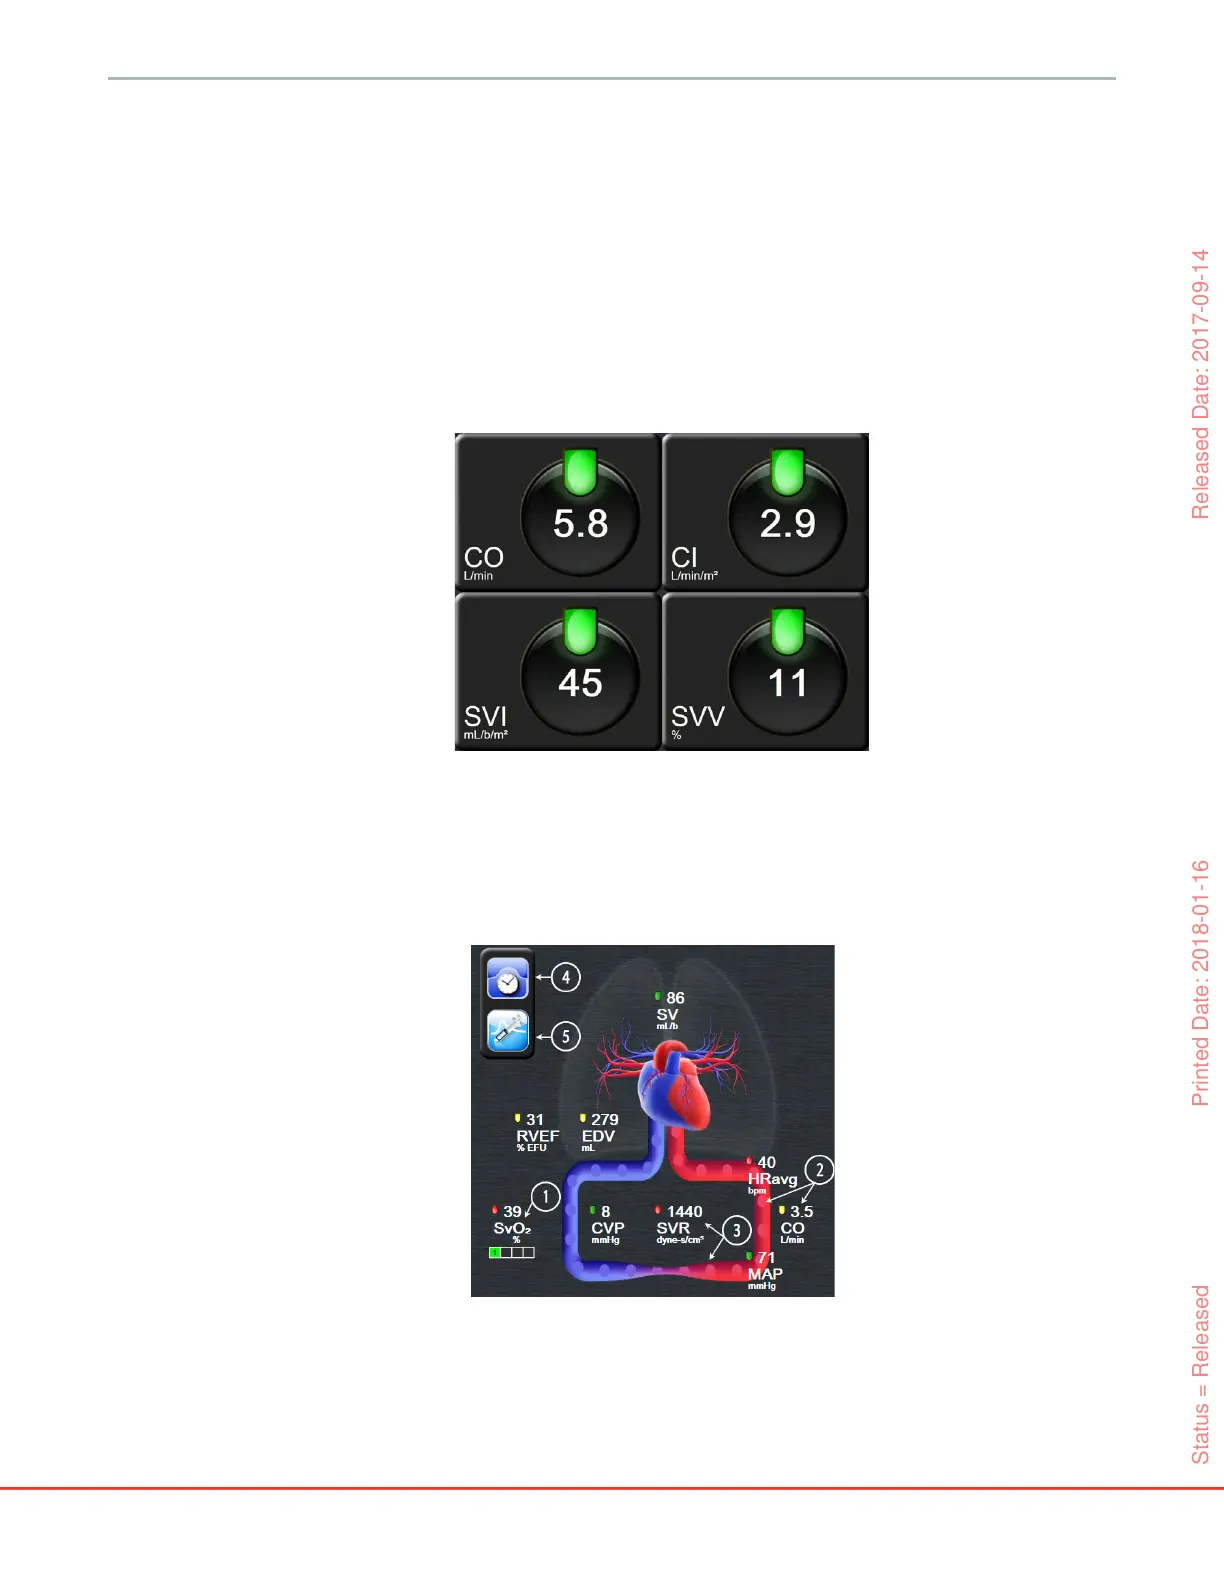
5.3.5 Big Numbers
The big numbers screen displays parameters in a larger size than the other screens. This makes it easier for
clinicians and other personnel to see the values from a distance.
5.3.6 Physiology Screen
The Physiology screen is an animation depicting the interaction between the heart, blood, and vascular
system.
Continuous parameter values are displayed in association with the animation.
Figure 5-11 Big numbers screen
Figure 5-12 Physiology screen while monitoring with
HemoSphere Swan-Ganz module
Status = Released Printed Date: 2018-01-16 Released Date: 2017-09-14