122
HemoSphere Advanced Monitor 9 HemoSphere Swan-Ganz Module Monitoring
NOTE No CO value will be displayed until sufficient time-averaged data is available.
9.2.3 Thermal Signal Conditions
In some situations where patient conditions create large changes in pulmonary artery blood temperature
over several minutes, the monitor may take longer than 6 minutes to obtain an initial CO measurement.
When CO monitoring is in progress, updating of the CO measurement may also be delayed by unstable
pulmonary artery blood temperature. The last CO value and measurement time will be displayed in place of
an updated CO value. Table 9-2 shows the alert/fault messages that appear on the screen at different time
points while the signal stabilizes. Refer to table 13-7, “HemoSphere Swan-Ganz module CO faults/alerts,”
on page 174 for more information on CO faults and alerts.
A fault condition terminates monitoring. A fault condition could result from migration of the catheter tip
into a small vessel preventing the thermistor from accurately sensing the thermal signal. Check catheter
position and reposition the catheter, if necessary. After verifying patient status and catheter position, CO
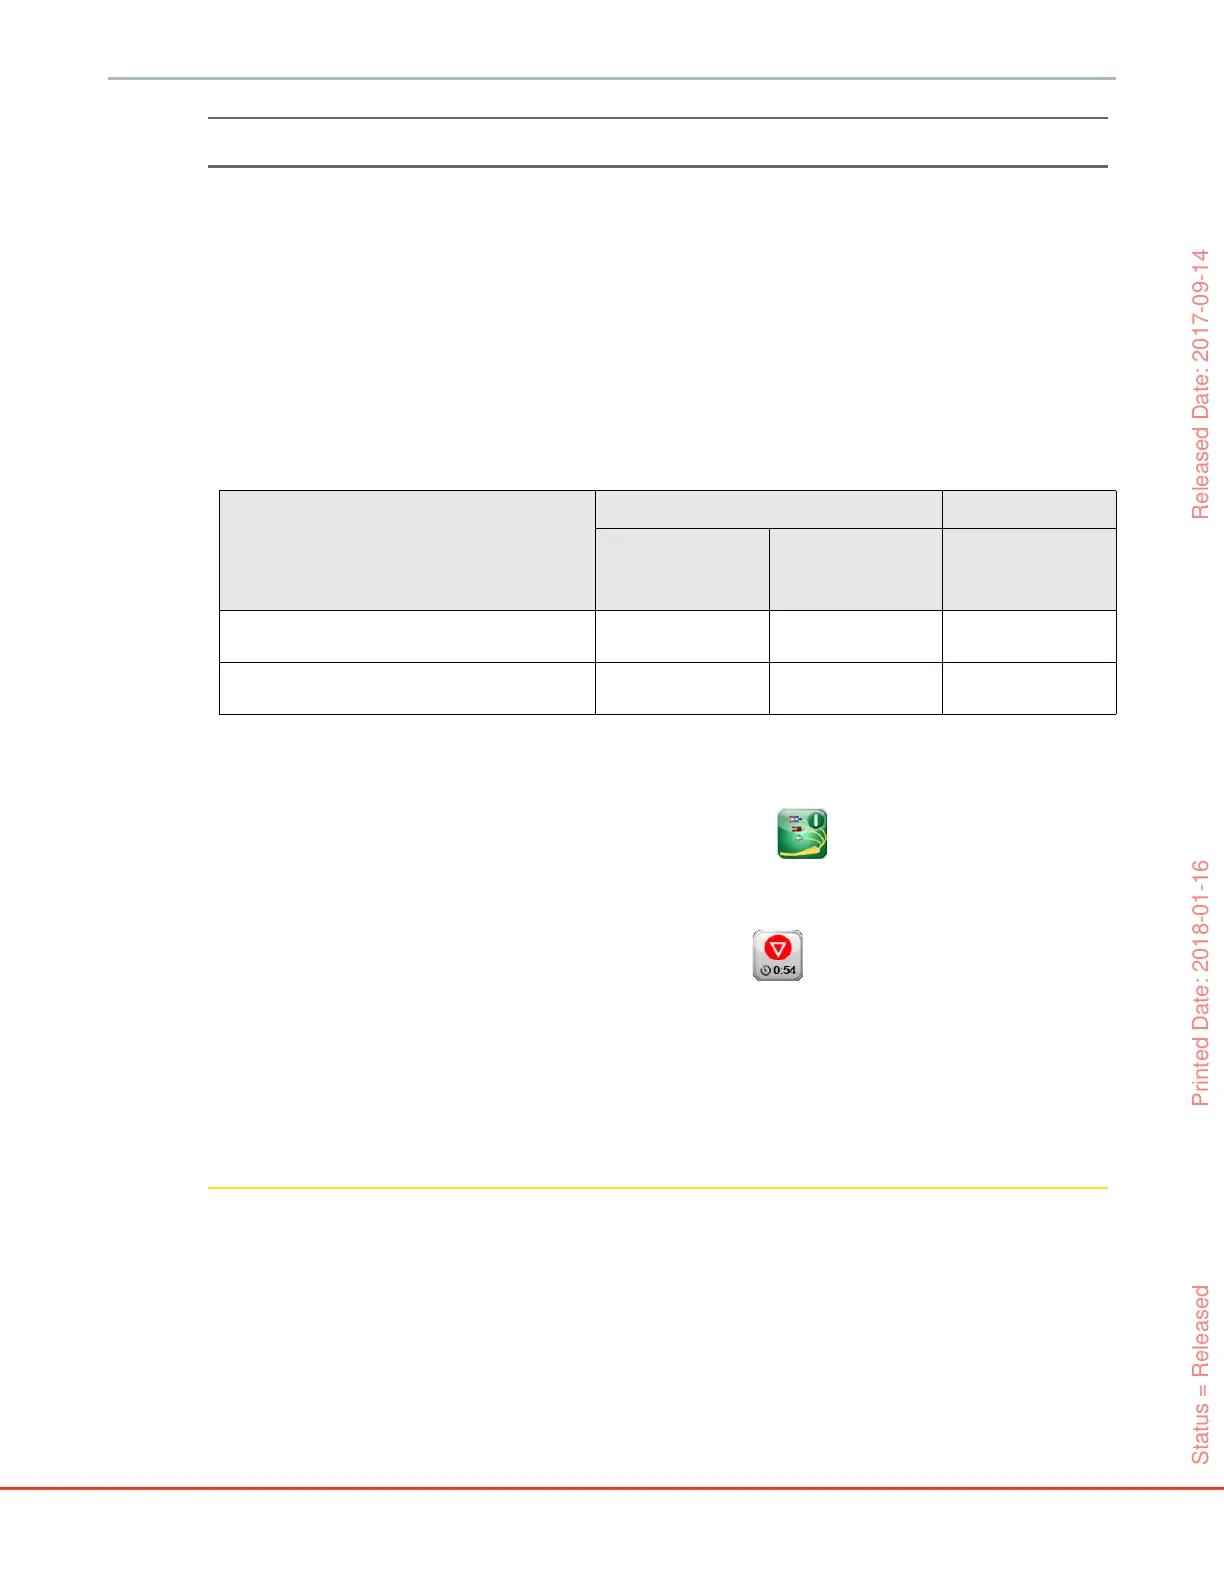
monitoring may be resumed by touching the start monitoring icon .
9.2.4 CO Countdown Timer and STAT CO
The CO countdown timer is located on the stop monitoring icon . This timer alerts the user as to when
the next CO measurement will take place. The time to the next CO measurement varies from 60 seconds to
3 minutes or longer. A hemodynamically unstable thermal signal may delay CO calculations. For longer time
spans between CO measurements, the STAT CO is available. The STAT CO (sCO) is a fast estimate of the
CO value and is updated every 60 seconds. Select sCO as a key parameter to view STAT CO values. Select
CO and sCO as key parameters while viewing the graphical/tabular trends split screen and CO monitored
data is graphically plotted alongside tabular/numerical data for STAT values of sCO. See Graphical/Tabular
Trends Split on page 72.
CAUTION Inaccurate cardiac output measurements may be caused by:
• Incorrect placement or position of the catheter
• Excessive variations in pulmonary artery blood temperature. Some examples that
cause BT variations include, but are not limited to:
* status post cardiopulmonary bypass surgery
* centrally administered cooled or warmed solutions of blood products
* use of sequential compression devices
• Clot formation on the thermistor
Table 9-2 Unstable thermal signal time lapse for CO alert and fault messages
Condition
Alert CO Fault CO
Signal
Adapting —
Continuing
Unstable Blood
Temp. —
Continuing
Thermal Signal
Loss
Monitoring Commencing: minutes from
commencement without CO measurement
61530
Monitoring in Progress: minutes from last
CO update
na 6 20
Status = Released Printed Date: 2018-01-16 Released Date: 2017-09-14