M2-6 031914
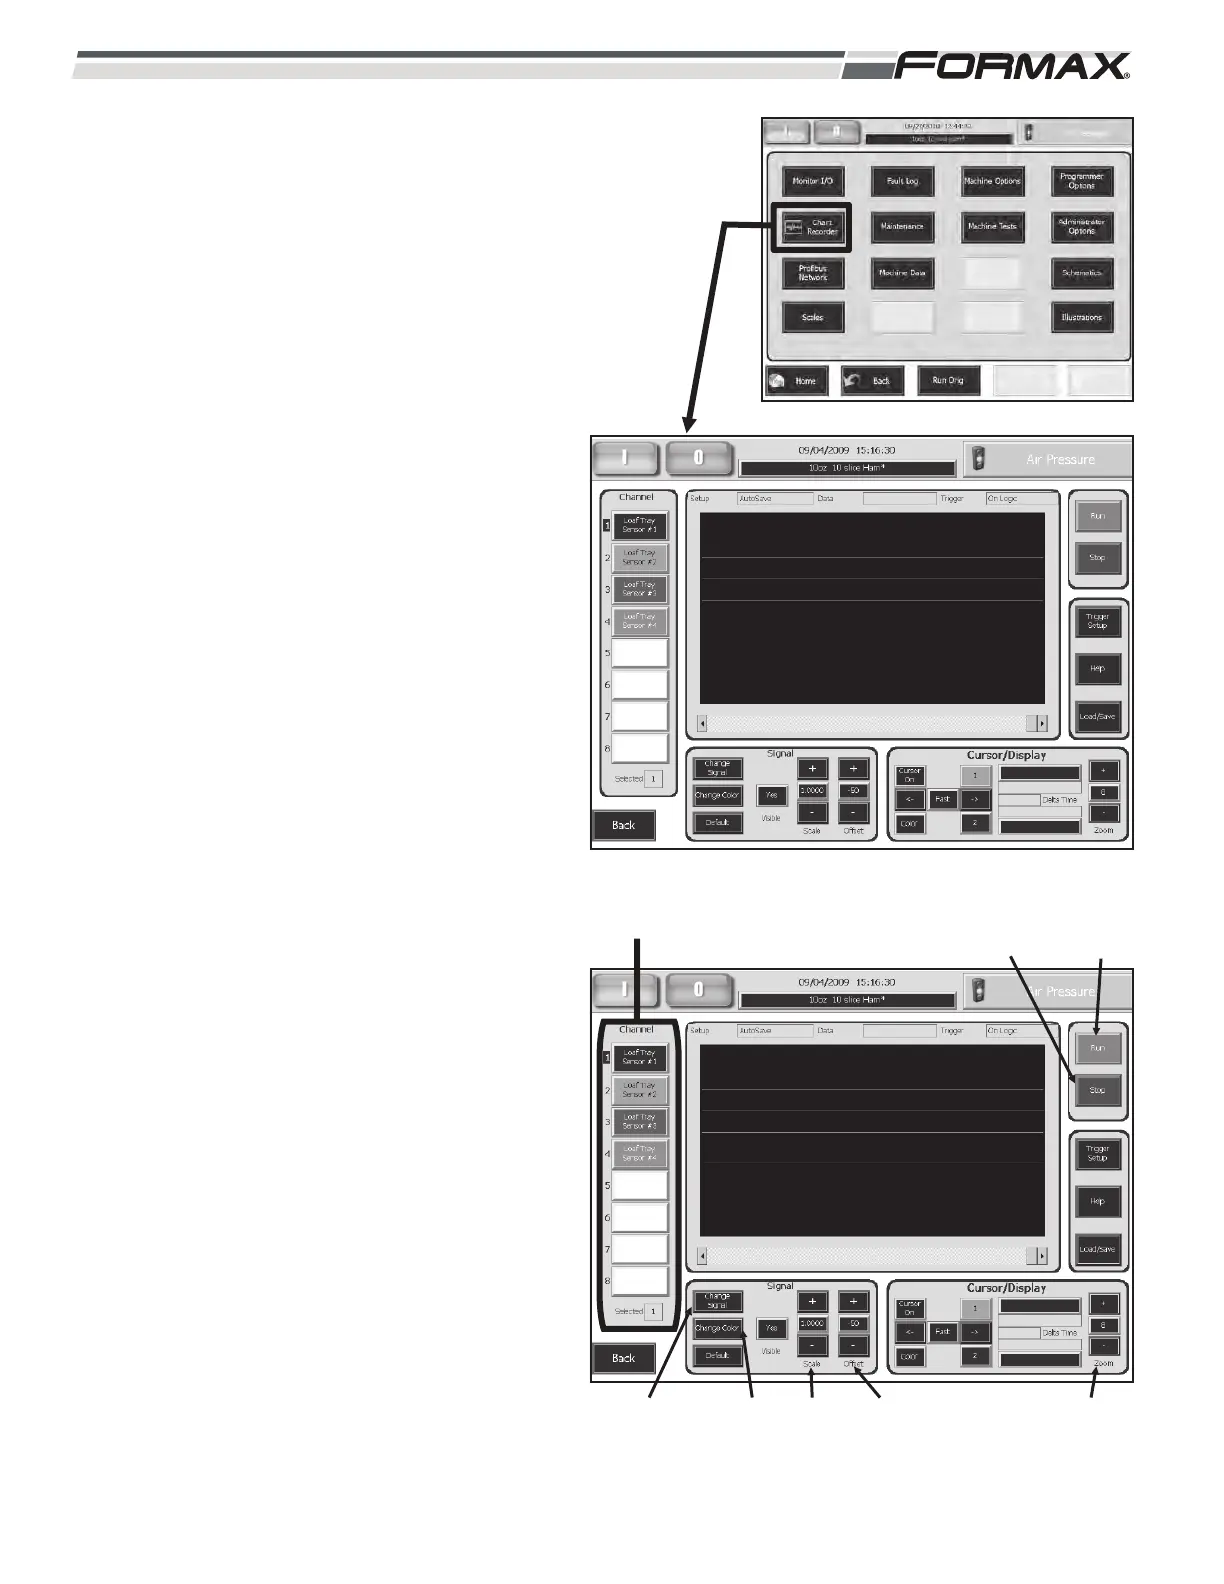
CHART RECORDER: The “Chart Recorder” screen
allows you to monitor and chart all of the Inputs and
Output signals. (Illustration 6) Up to 8 signals can be
monitored at one time. The Chart Recorder can be
set up and run, while using a different screen to
operate the machine or one of the Machine Tests
screens.
To “Chart” a signal:
1. Select a “Channel” from 1 to 8. (Illustration 7)
2. Select a “Color” to display the Chart.
3. Touch the “Visible” button until it says “Yes.”
4. Touch the “Change Signal” button to display
the list of the signals. (Illustration 7)
a. Use the “Up/Down” arrows to scroll
through the list of Input and Output
signals.
b. Touch and highlight the signal you would
like to chart and touch the “OK” button to
select it.
5. Touch the “Run” button to start the Chart.
6. Use the “+” and “-“ Offset buttons to center
the Chart on the screen.
7. Start running the machine or use one of the
Machine Test screens to operate and monitor
the signal on the Chart Recorder.
8. Use the “Scale” buttons to increase or
decrease the size of the Chart.
9. Touch the “Zoom” display button to increase
or decrease the Chart speed. (Illustration 7)
Enter a Chart Speed from 1 to 10 on the
Keypad and touch the “Ok” button to enter
the speed.
1 = Slowest Chart Speed.
8 = Default Chart Speed.
10 = Fastest Chart Speed.
10. Touch the “Stop” button to stop the Chart.
ILLUSTRATION 6
ILLUSTRATION 7
CHANNELS
“CHANGE
SIGNAL”
BUTTON
“CHANGE
COLOR”
BUTTON
“RUN”
BUTTON
“SCALE”
BUTTONS
“OFFSET”
BUTTONS
“STOP”
BUTTON
“ZOOM”
BUTTON