Monitor the WiFi Network and Its Components
347
ProSAFE Wireless Controller
The wireless controller’s login window opens.
2. Enter your user name and password.
3. Click the Login button.
The wireless controller’s web management interface opens and displays the Summary
page.
4. Select Monitor > Controller > AirQual.
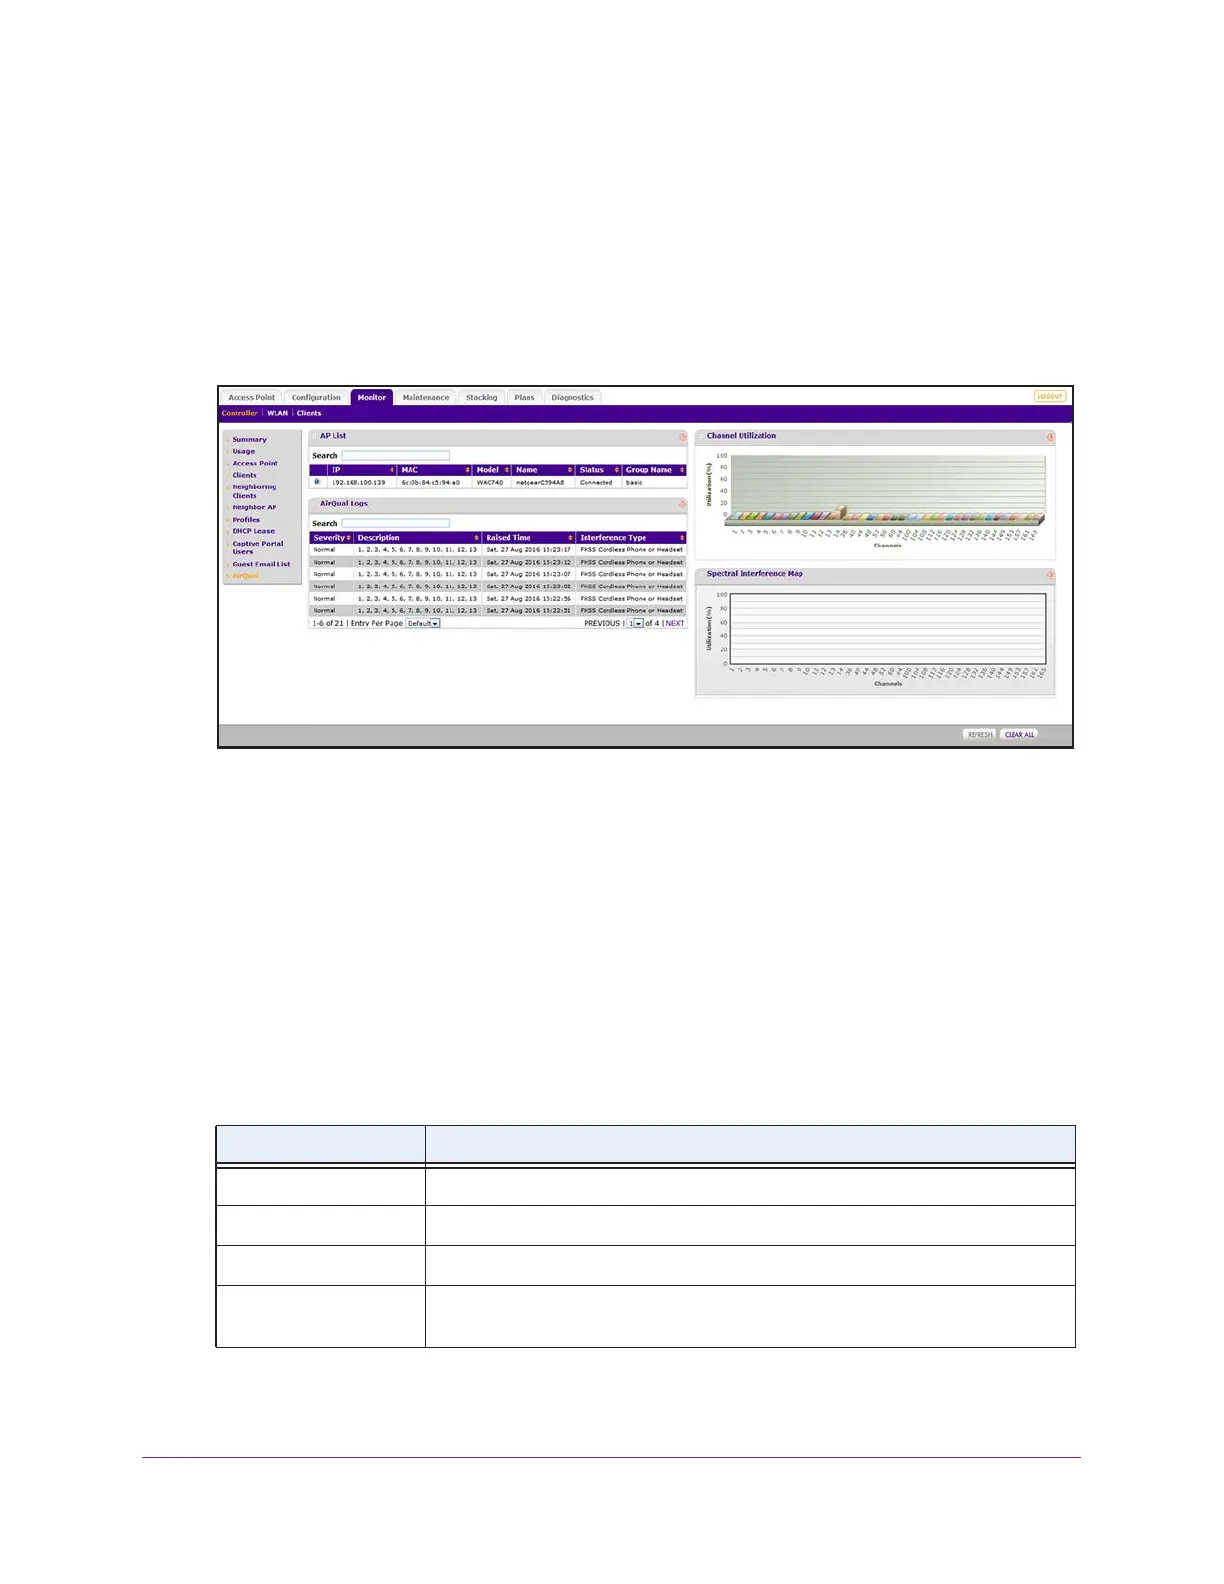
The AP List includes the WAC740 access points for which AirQual is enabled. (In the
previous figure, AirQual is enabled for a single WAC740 access point only.)
5. If the AP List includes more than one WAC740 access point, select the radio button for a
WAC740 access point.
The page adjust to display the utilization, interference, and logs for the Wifi network of the
profile group that the WAC740 access point monitors.
On the right side of the page, the Channel Utilization graphic illustrates the percentage of
utilization for each individual channel in both radio bands of the WiFi network and the
Spectral Interference Map graphic illustrates the percentage of non-WLAN interference
for each individual channel of both radio bands in the WiFi network.
The following table describes the fields of the AirQual Logs table.
6. To sort the table, click the double triangle icon or single triangle icon at the top right of a
column.
Field Description
Severity The severity of the interference (Normal or Major).
Description The description of the interference event and the impacted channel or channels.
Raised TIme The time at which the interference was detected.
Interference Type The type alert (for example, quality is below threshold) or type of interference (for
example, FHSS Cordless Phone or Handset, or Microwave Oven).

 Loading...