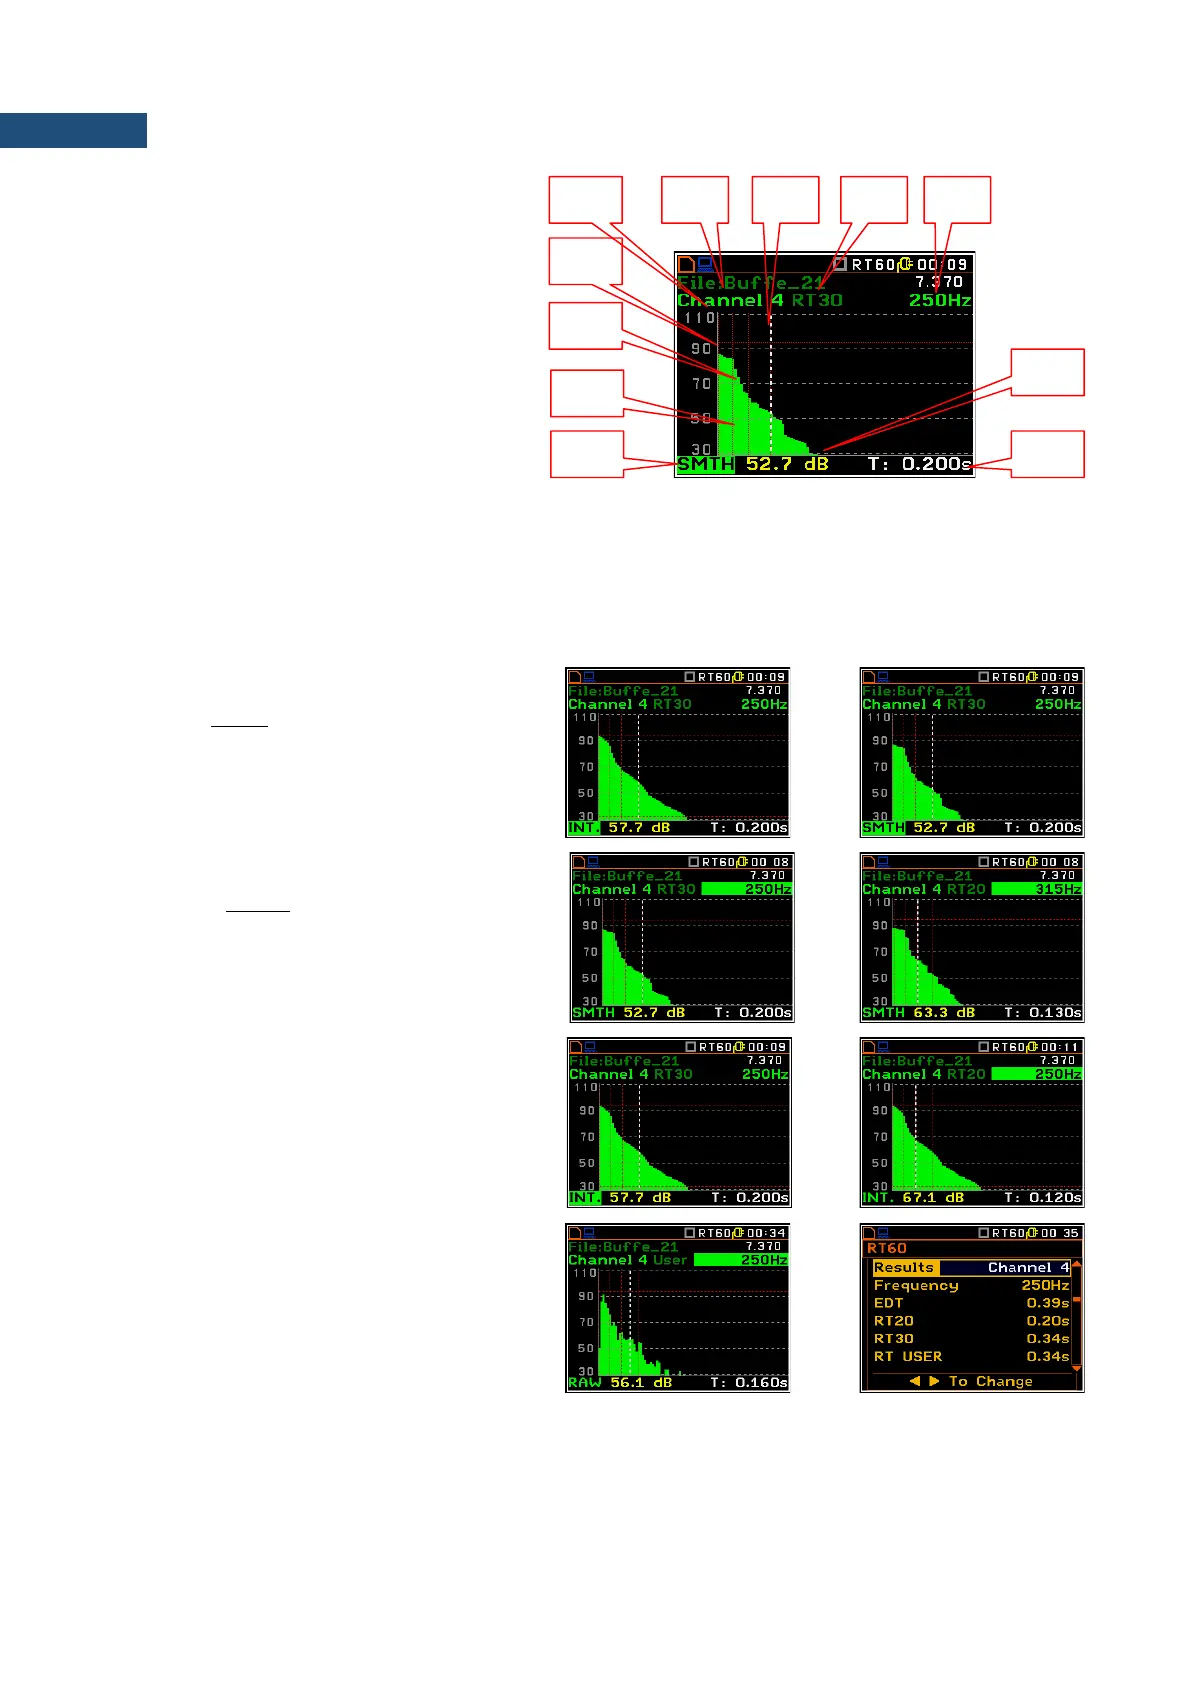
Sound pressure decay curve plot
1. Channel number
2. T0 marker position
3. Decay curve plot
4. T1 marker position
5. Type of data displayed: RAW, SMNH or
INT.
6. Name of the logger file
7. Cursor position
8. RT result (RT30, RT20, EDT and
RT User) with calculated reverberation
time
9. Central frequency of selected by cursor 1/3 octave band
10. Result value (SPL) for the cursor position
11. Cursor measurement time position
T0 marker position is used as a starting point to all three (and the RT User also) reverberation time calculations.
On the display T1 marker position is labelled (indicator A7) as EDT, RT 20 or RT 30 according to which the
most restricted definition of the RT condition is fulfilled.
Changing the data type
When the field 5 is active the type of data
displayed (RAW, SMTH or INT.) can be
changed after pressing the ◄ and ► keys
together with <Alt>.
Changing the 1/3 octave band
When the field 9 is active the central
frequency of 1/3 octave band can be changed
after pressing the ◄ and ► keys together
with <Alt>.
Changing the cursor position
The user may change the cursor position by
means of the ◄ / ► key.
RT User reverberation time calculation
The user reverberation time is calculated for
the cursor positions at each Sound pressure
decay curve plots.
For example, if cursor is set to T: 0.160s for
the 1/3 octave band with 250Hz center
frequency, the RT User result will be
presented in the table of RT result for 250Hz
band.