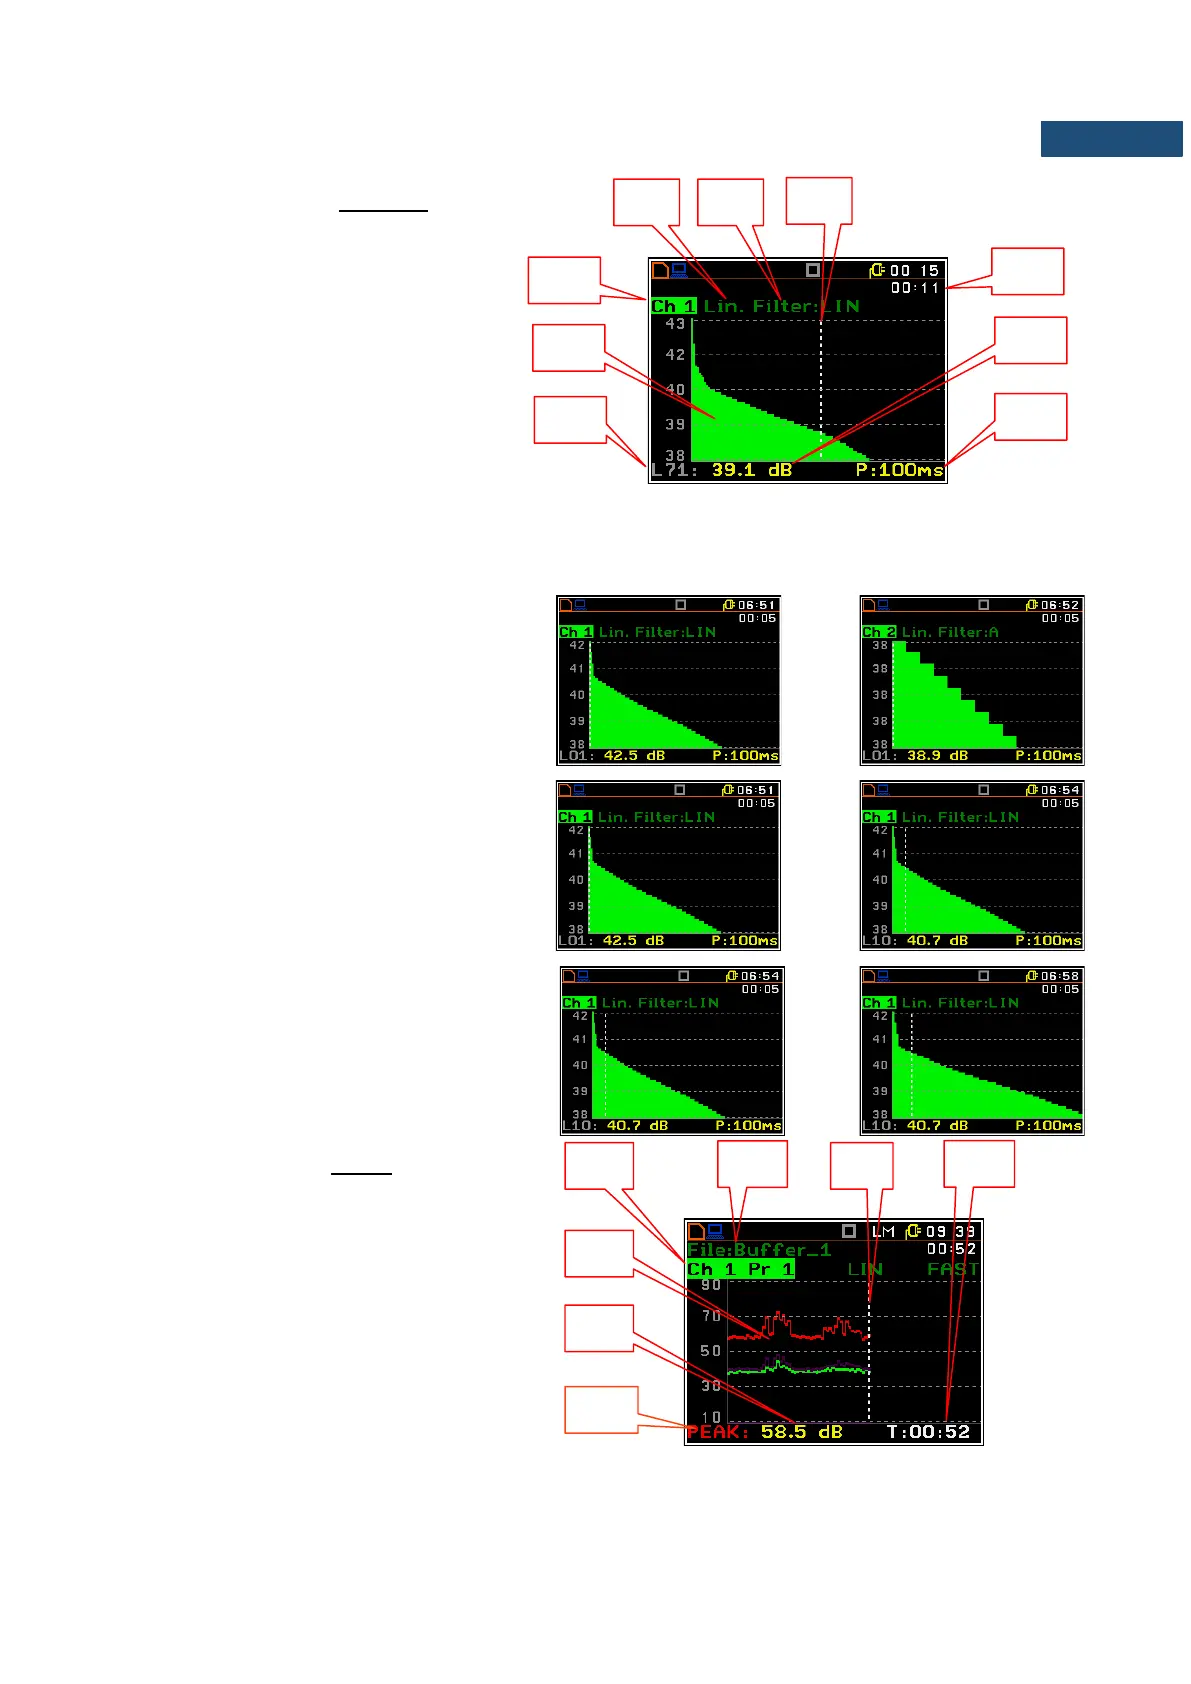
Field description of the Statistics view
1. Channel number
2. Statistics plot
3. Statistical level (LN% percentile value)
for the active cursor position
4. RMS detector (Lin., or Exp.: Fast,
Slow or Imp.)
5. Frequency filter used (A, C or Z)
6. Cursor position
7. Elapsed time shows the current
second of the measurement in the
range [1, Meas. Period]
8. Value of the selected statistical level
LN% and units (dB)
9. The sampling interval for the LN%
values calculated by the meter (0.1s).
The channel is changed by pressing the ◄
and ► keys simultaneously with <Alt>.
The cursor position is changed using the
◄ / ► key. The statistical level (%) and
appropriate (dB) value are presented in the
line below the plot.
Press the ◄ / ► key with <Shift> to extend
the X axis.
Presentation mode for logger view
The time history of results saved in the logger
can be presented in the special Logger
mode. The Logger mode can be activated or
deactivated in the Display Modes list.
1. Channel and Profile number
2. Logger plot
3. Result value for the cursor position
4. Name and colour of the logged result
5. Name of the logger file
6. Cursor
7. Cursor position value