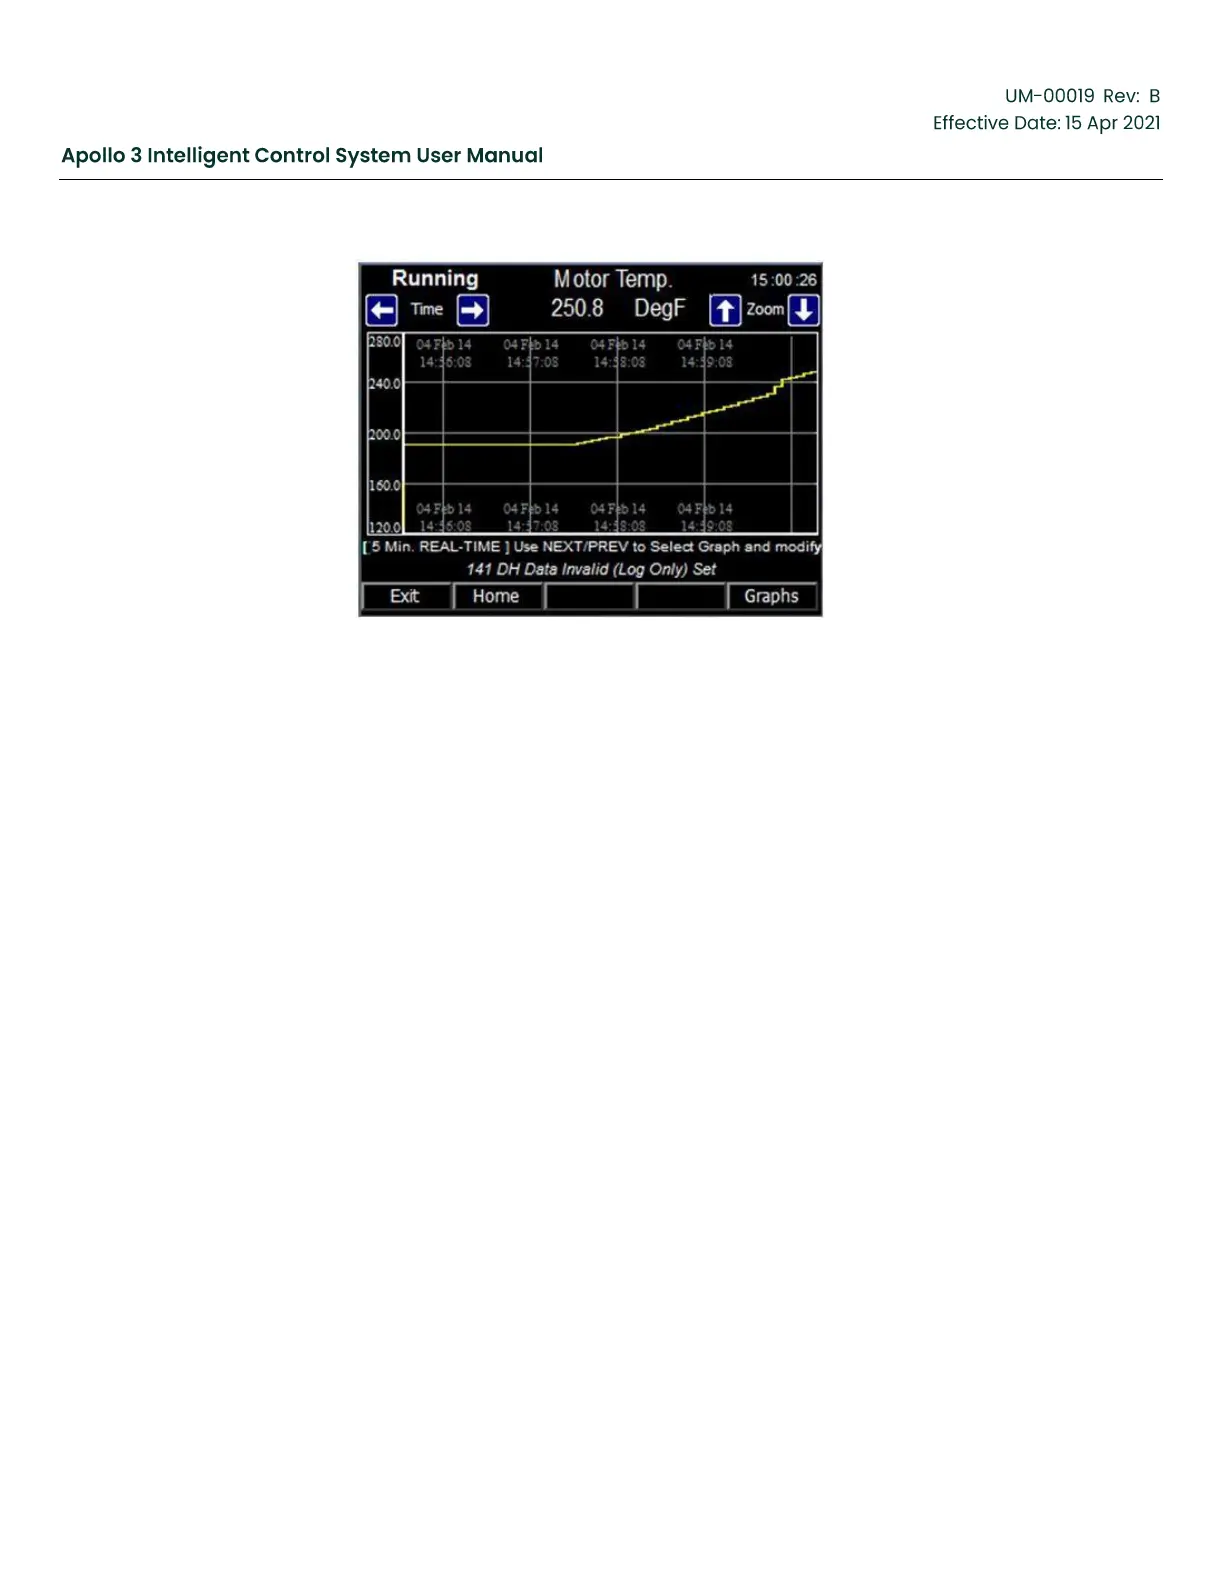
Figure 48: Graphs Screen
Function:
The Graph Screen displays the historical data in a graphical format. Each parameter on the data
display screen is shown on a separate graph.
Screen Data
Historical data for the system parameter shown on the top of the screen is shown on the graph.
In the example shown, the Motor Temperature (y-axis) is graphed against time (x-axis).
•
Numeric Value – The current value of the parameter is displayed just below the parameter
name.
•
Graphical Value – The value of the parameter being measured is graphed along the y-axis
•
Range – The range of time of the parameter being measured is graphed along the x-axis
Keypad Functions:
F1: “Exit” – Returns to the calling data display screen.
F2: “Home” – Closes the current screen and displays the Home screen.
F5: “Graphs” – Displays the graph screen for the next parameter on the calling data display
screen.
Arrows:
•
Up, Down – Zoom In/Zoom Out of the graph. The shortest graph displayed is 5 minutes. The
longest graph displayed is 14 days.