C8000 Battery Testing System User Manual
3 Cadex BatteryLab 103
1. From the Tools menu, select BatteryLab Configuration.
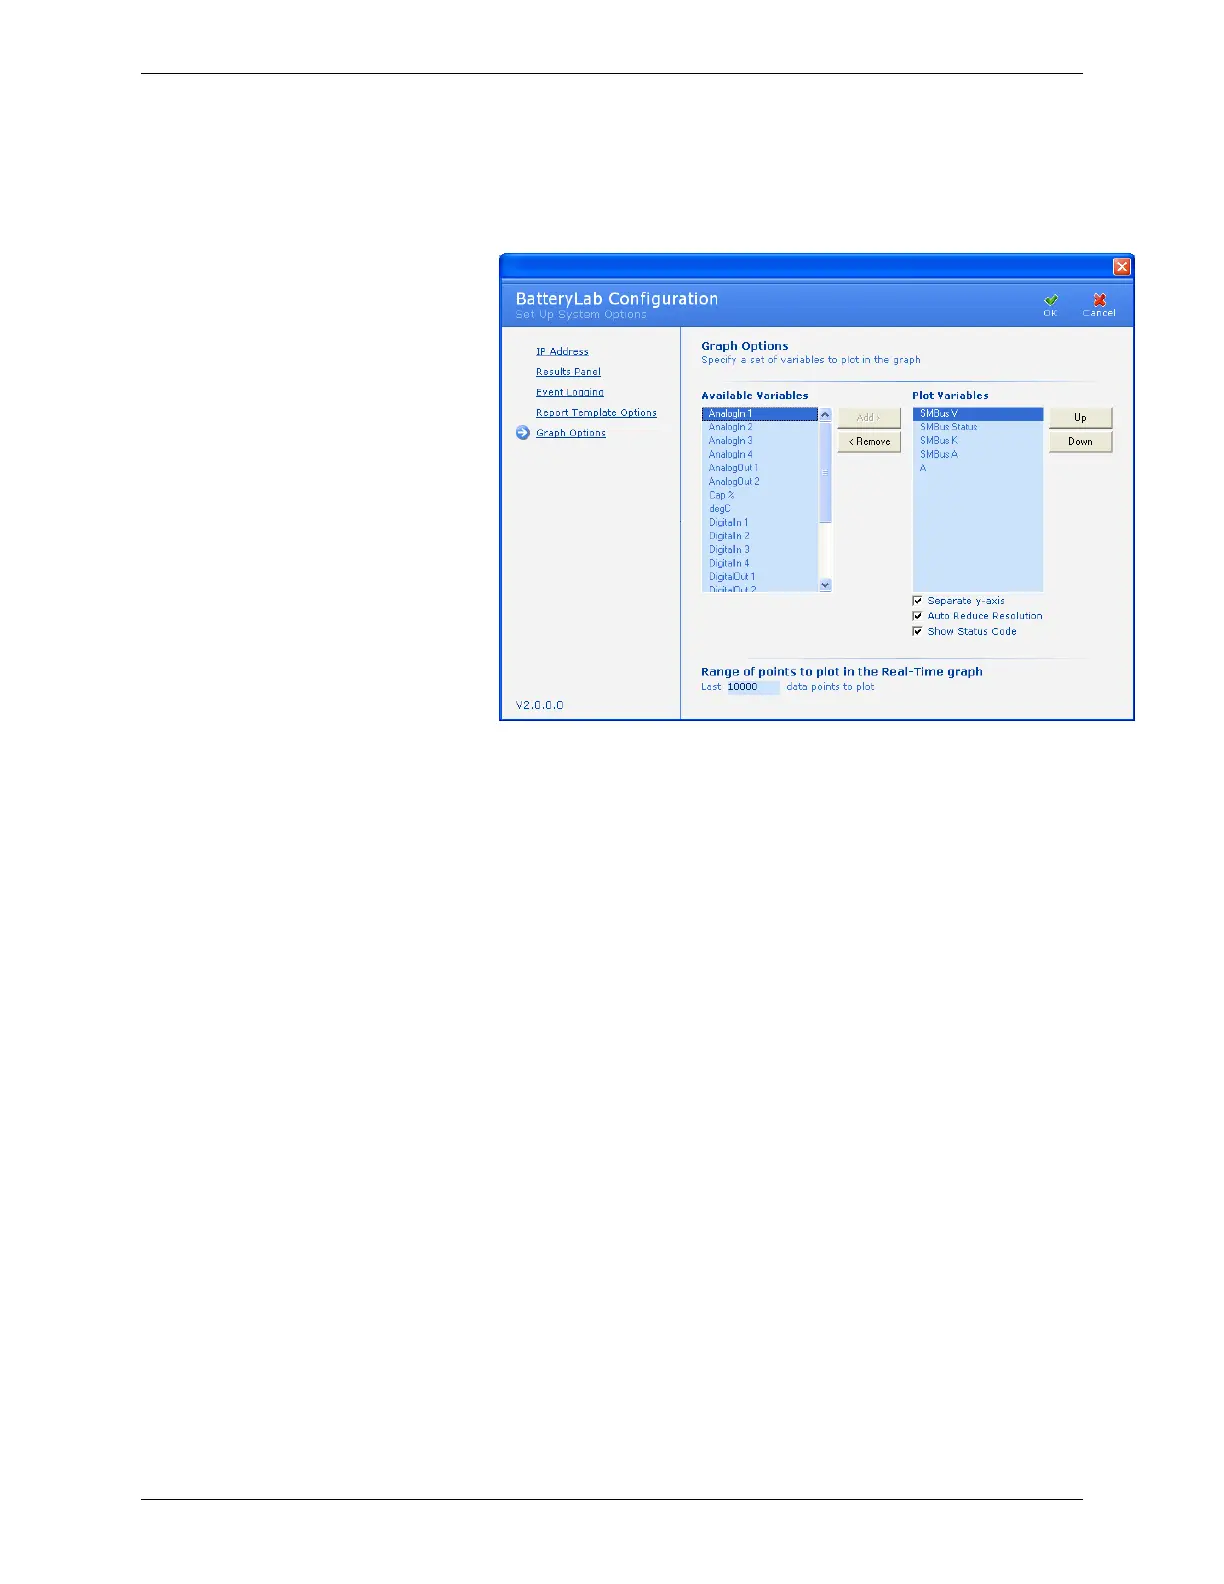
The BatteryLab Configuration window appears. Click
Graph Options. The Graph Options window appears.
2. To add a variable, select the variable in the Available
Variables column and click Add. Note: A maximum of 4
variables can be plotted at anytime.
3. To remove a variable, select the variable in the Plot
Variables column and click Remove.
4. To adjust the order of display for a variable in the plot,
select the variable in the Plot Variables column and click Up
or Down.
5. To display the separate Y-axis for the selected variables,
select the Separate y-axis check box.
6. Specify the last range of points to plot (the default is 10000)
in the graph in the Last x available data points field. Note: All
Real-time graphs have a maximum of 10000 points.
7. To Display the program’s Status Code during the service
select the check box.
8. Auto Reduce Resolution will decimate the graph, reducing
the number of points displayed for large graphs over 1000
points, increasing the graph display response. All points
are still viewed as the graph is zoomed in.
9. Click OK.