Cleverscope CS300 Reference Manual v2.11
Page 114 www.cleverscope.com ©Cleverscope 2004-2015
Automatically measures the DC on any signals, estimates the AC signal
amplitude and then sets up the graphs appropriately.
After completing the plot, the A and B channel 'Fit' commands are run to fit
the Spectrum display. After the first Auto Setup, you can turn the control
off, and make small adjustments yourself.
Note that Ctrl Up Arrow and Control Down Arrow zoom vertically on the
tracer position, which can be handy to see detail.
selects a Log or Linear Frequency axis.
draws a line between each frequency/amplitude point and the next to
improve the look of the graph. If you want to see just the measurement
points, turn this option off.
Sets DC or AC coupling for the two channels (you can still set channels
individually using the Cleverscope Control Panel). If the signal being probed
exceeds +/-24 V DC you will need to use AC coupling. The AC -3dB lower
cutoff frequency is 5 Hz (1x) or 0.5Hz (10x).
This is the response voltage goal. Ideally it should not alter the system
performance but result in good Signal to Noise Ratio (SNR). For power
supplies a response goal of 3- 10 mV is appropriate. For Passive devices such
as filters, transfomers etc, use 500 mV. The Response V Goal is used by
Sweep Amplitude = Auto to achieve the correct Stimulus. If the SNR is <3,
the system will automatically reduce the Bandwidth. Alternatively you could
increase the Response V Goal, provided it does not affect your system.
When using Auto or Table methods for determining the signal generator
amplitude, an absolute limit of this value (in V p-p) will be applied.
The Frequency Bin bandwidth is set automatically as the sweep proceeds.
You can limit the maximum bandwidth used to improve collection of low
amplitude signals. Increasing the bandwidth reduces sample collection time,
but also reduces the dynamic range. Reducing the bandwidth increases
sample collection time and dynamic range, allowing you to measure smaller
signals. Usual values are 1kHz or 100 Hz.
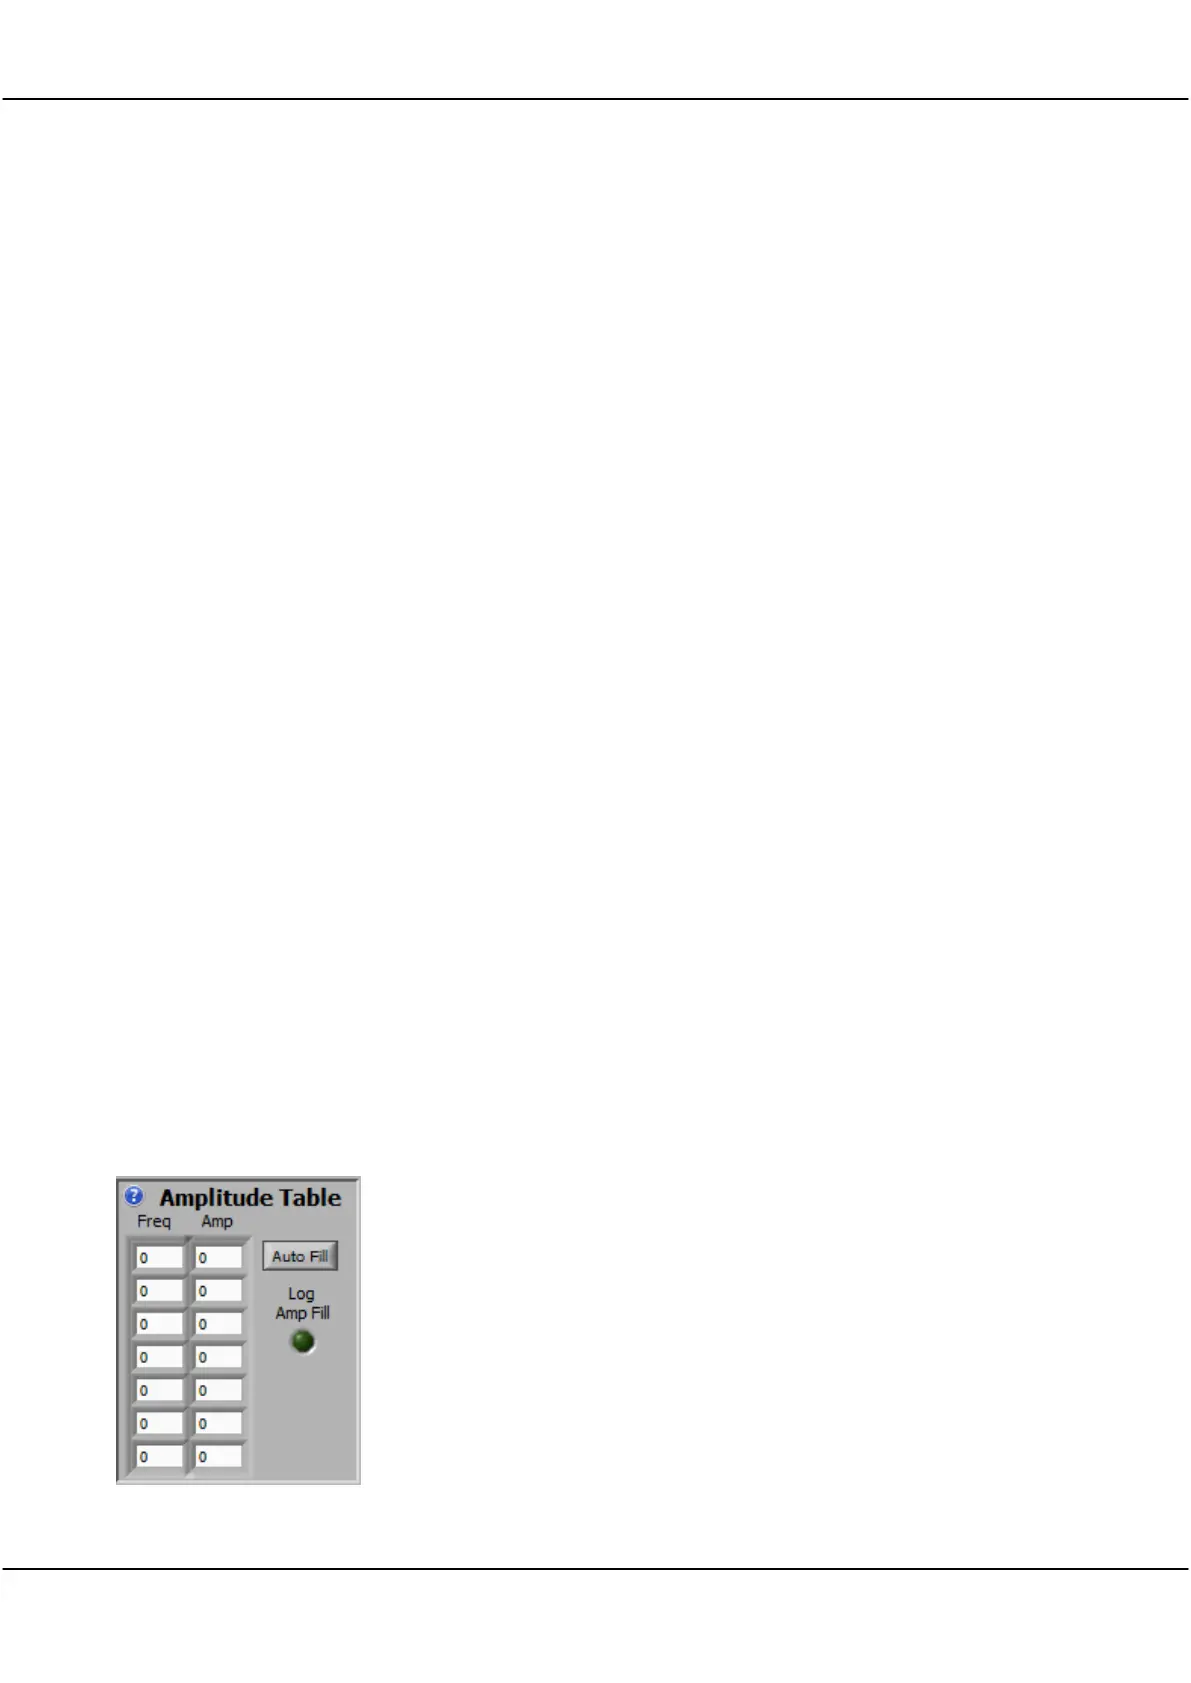
17.5.5 Amplitude Table
Use this panel to setup the table used to set the amplitude when the Sweep
Amplitude control is set to Table.
The Table is used to generate an open loop varying frequency/amplitude
plot to compensate for gain variations which are not easily handled by the
Auto method of amplitude control.
Most amplifiers and power supplies have high gain at low frequencies,
falling off as frequency increases. If the gain includes discontinuities, or the
signal levels are very low, the table is a good approach.
Type values into the Frequencies or Amplitudes entries. The signal generator
does linear interpolation between the first two frequencies that straddle the
output frequency.