108
HemoSphere Advanced Monitor 7 Advanced Settings
3 Touch Parameter Settings button Adjust Scales button.
NOTE The screen will return to the monitoring view after two minutes of inactivity.
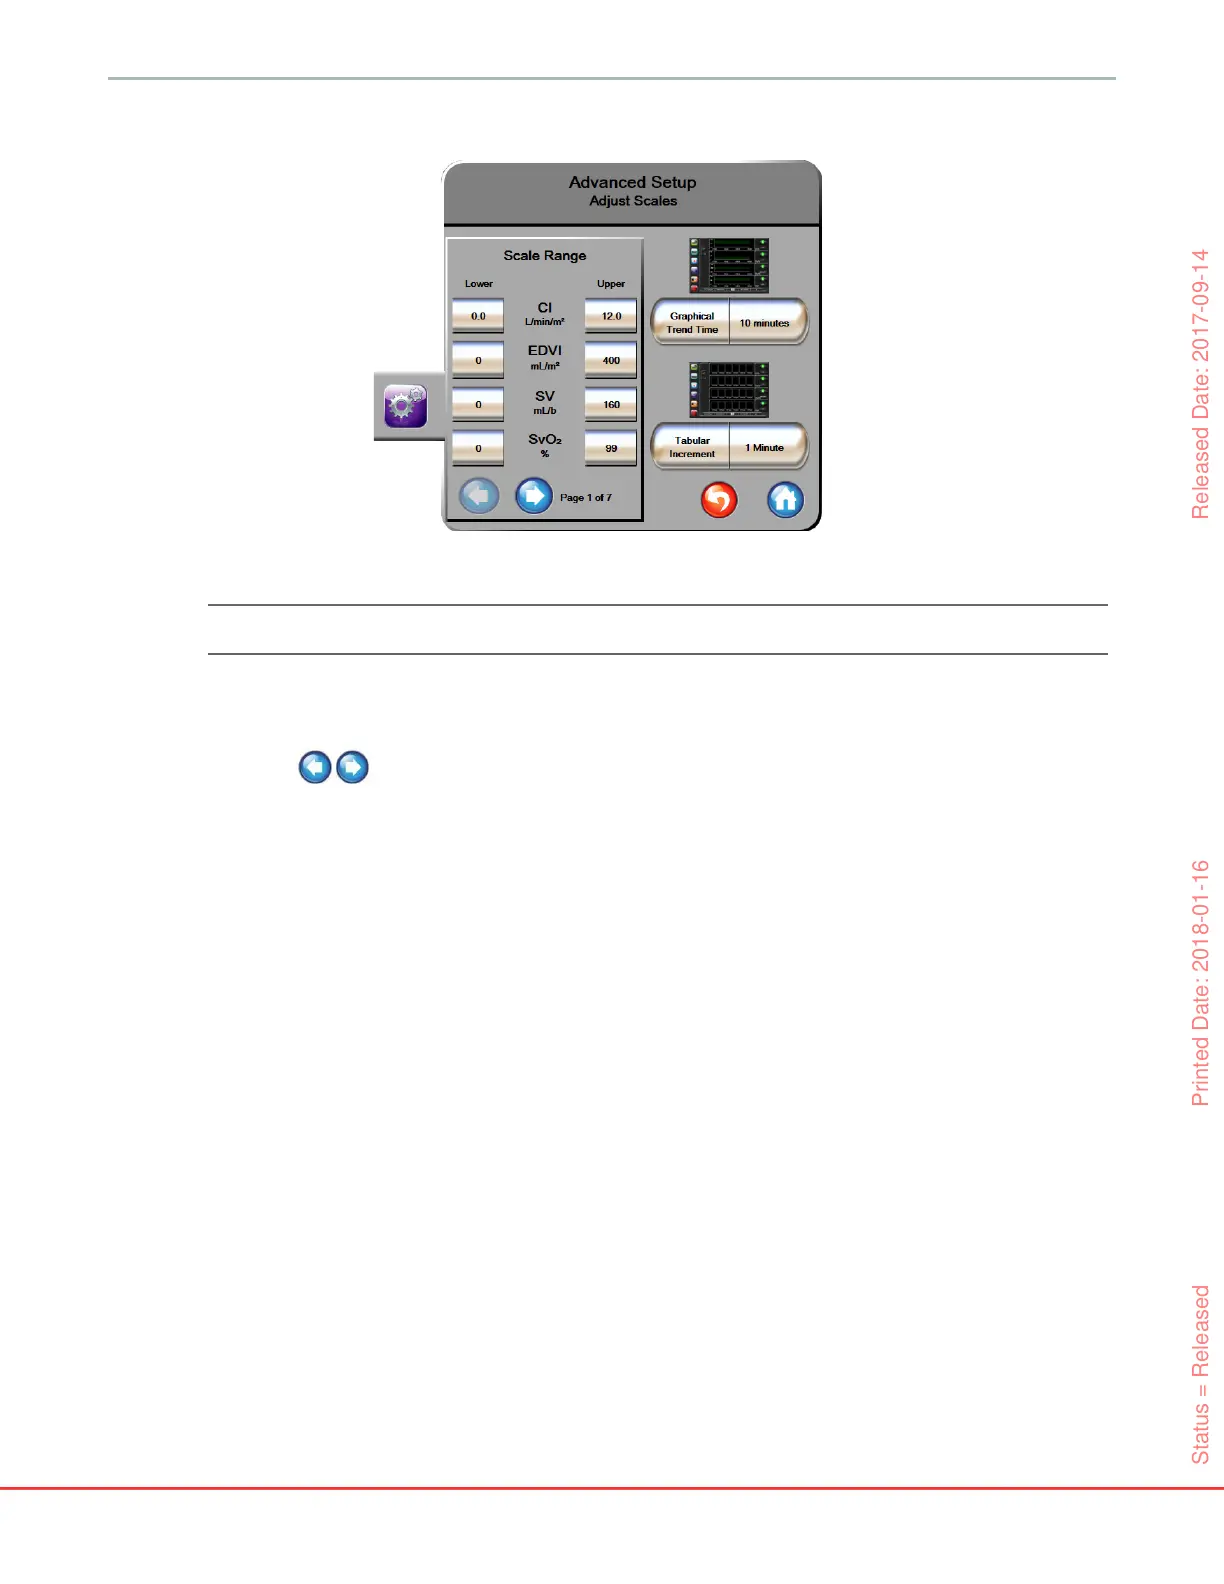
4 For each parameter, touch the Lower button to enter the minimum value to appear the vertical
axis. Touch the Upper button to enter the maximum value. Use the horizontal scroll icons
to view additional parameters.
5 Touch the right side of the Graphical Trend Time value button to set the total amount of time
displayed on the graph. The options are:
6 Touch the right side of the Tabular Increment value icons to set the amount of time to each
tabbed value. The options are:
Figure 7-5 Adjust scales
• 3 minutes • 1 hour • 12 hours
• 5 minutes • 2 hours (default) • 18 hours
• 10 minutes • 4 hours • 24 hours
• 15 minutes • 6 hours • 48 hours
• 30 minutes
• 1 minute (default) • 30 minutes
• 5 minutes • 60 minutes
• 10 minutes
Status = Released Printed Date: 2018-01-16 Released Date: 2017-09-14