HemoSphere Advanced Monitor 12 Advanced Features
157
The secondary screen, along with other key parameters on the monitoring screen, can be used to provide
potential insight into the cause of a high hypotension probability or hypotension when such an even occurs.
The parameters displayed on the Hypotension Probability Indicator secondary screen include the following
key parameters:
• cardiac output (CO)
• pulse rate (PR)
• mean arterial pressure (MAP)
• stroke volume (SV)
• systemic vascular resistance (SVR)
Additional advanced parameters are arranged visually on the screen by preload, contractility, and afterload.
These advanced parameters are:
• stroke volume variation (SVV)
• left ventricular contractility (dP/dt)
• dynamic arterial elastance (EA
dyn
)
For all of the parameters on the Hypotension Probability Indicator secondary screen, the percent change and
direction of change (via up/down arrow) over a user-selectable time interval are also displayed.
To access the Hypotension Probability Indicator secondary screen, choose one of the following:
• Touch the More Information button on the P(↓BP) high alert popup.
• Touch the P(↓BP) information bar indicator button .
• Touch the P(↓BP) key parameter shortcut icon .
• Touch he clinical actions icon More icon Hypotension Probability icon .
To change the percent change interval, perform the steps described in Time Intervals / Averaging on page 94
and select the desired continuous % change interval. If none are selected, the default percent change interval
will be 5 minutes.
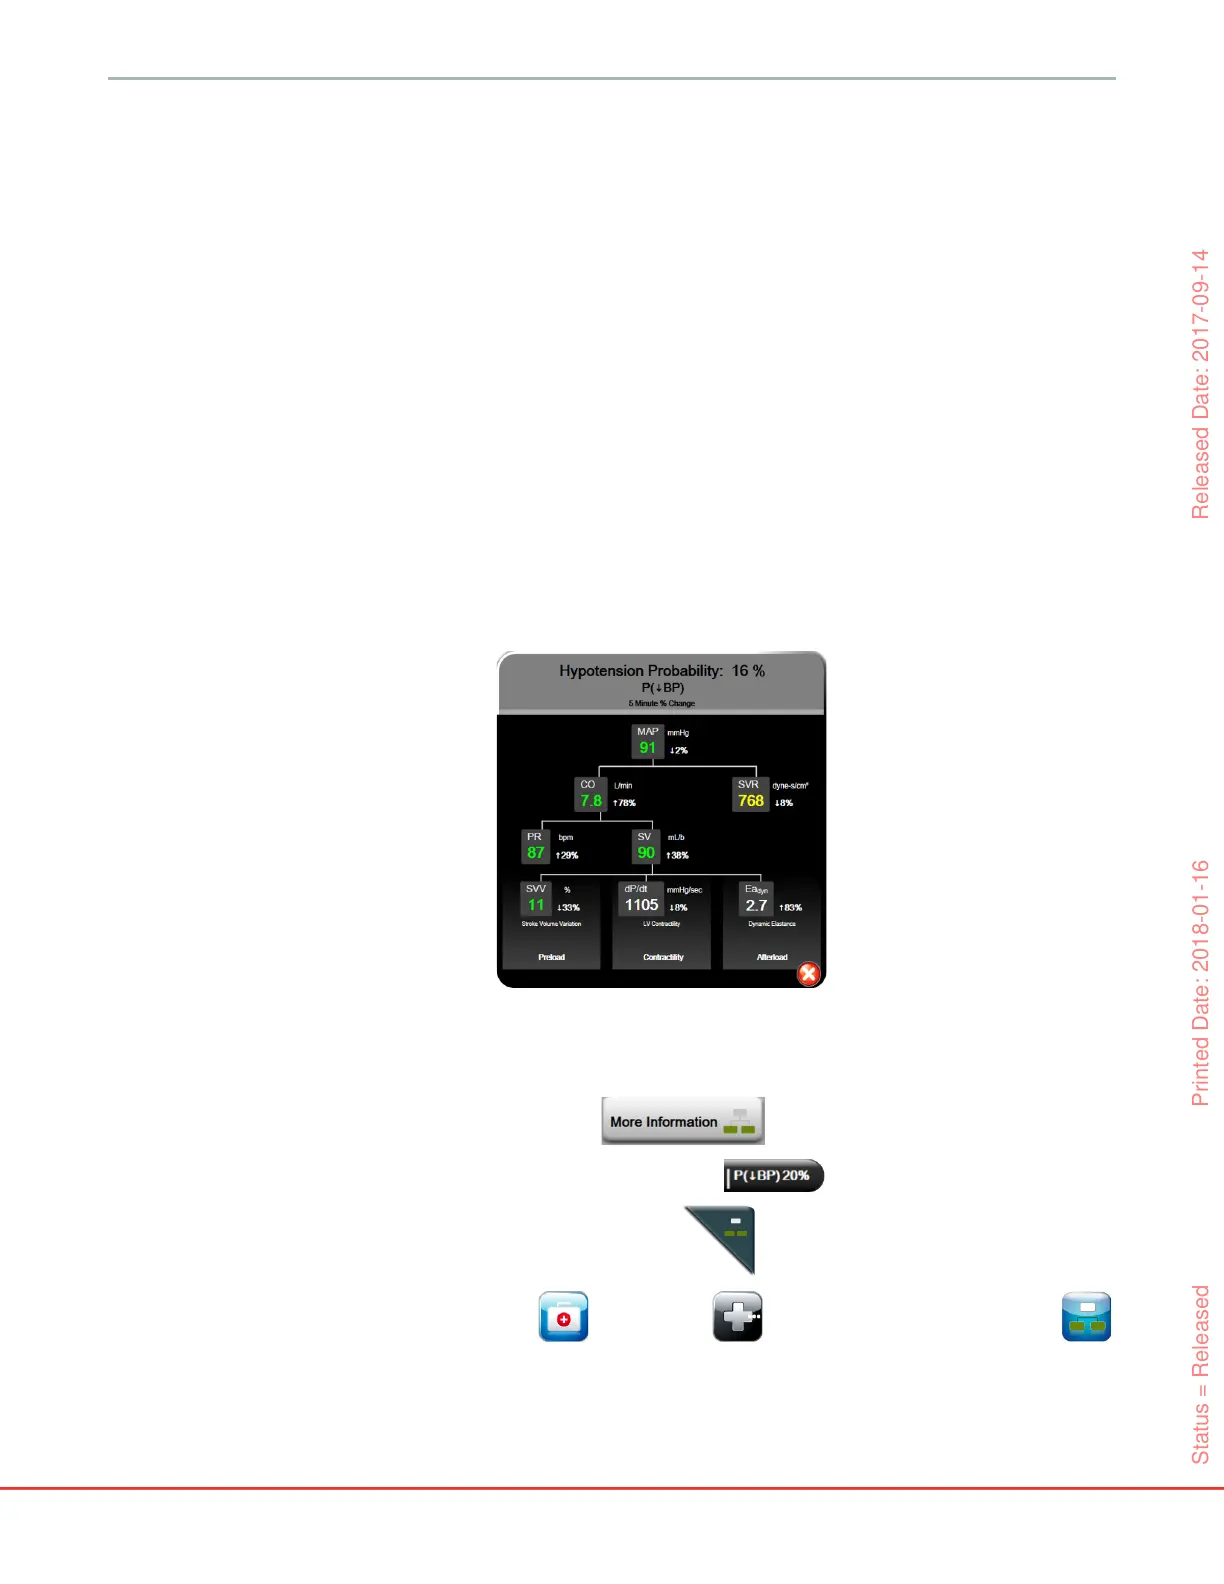
Figure 12-6 Hypotension Probability Indicator secondary screen
Status = Released Printed Date: 2018-01-16 Released Date: 2017-09-14