3. If required, you can display the group's trend by choosing the option from the View As
list.
Using trend displays
A trend display shows changes in point parameter values over time. Typical uses of trend dis-
plays are to show changes in room temperature or power consumption over the day.
Trends can display data in several ways, including:
n Line graphs (the default)
n Bar graphs
n Numerical list of historical data
n X-Y plot of the value of one point against another (that is, one point on the x-axis and
the other on the y-axis)
Each trend is identified by a number, and generally has a descriptive title.
Attention:
Note that you cannot call up trend numbers 2901 to 3000, as these numbers are
used for alarm trackers. If you try to call up a trend number in this range, Station
displays an error message.
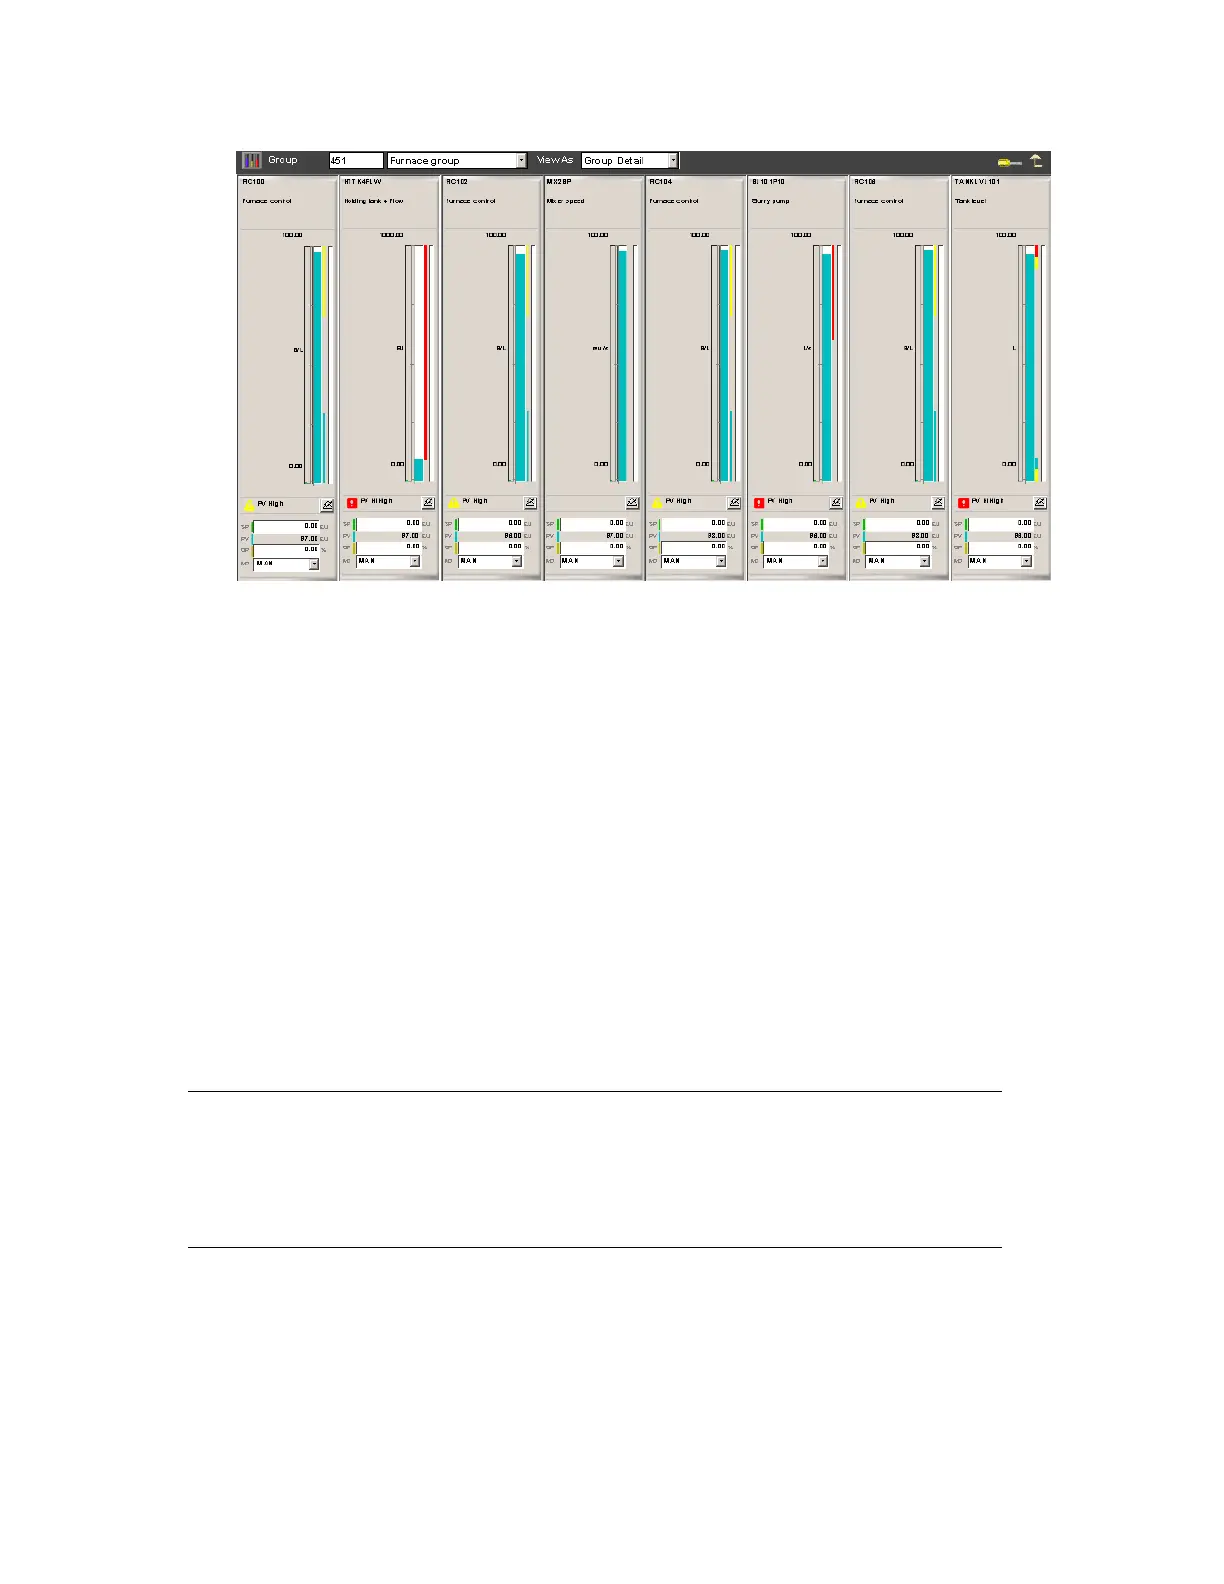
Displaying detailed process information
Honeywell 2017 221

 Loading...