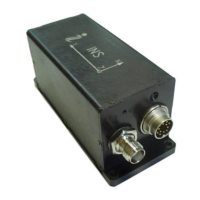
INS
GUI User’s Manual
Inertial Labs, Inc
TM
Address: 39959 Catoctin Ridge Street, Paeonian Springs, VA 20129 U.S.A.
Tel: +1 (703) 880-4222, Fax: +1 (703) 935-8377 Website: www.inertiallabs.com
67
Two icons appear in the status bar: “Warnings” and “Failures” .
Warning and failure messages are generated by INS in its Unit Status Word
(see Appendix D) and appear near and icons. You can close these
messages by clicking on them.
Also, average data rate appears in the left part of the status bar in about 10
seconds after INS started data output. Note this is rate of data received by
PC, not INS data rate. So numbers in the status bar are variable in contrast
to stable data rate of INS unit. Shown data rate is helpful if INS unit started
automatically, without command from INS GUI, so user could not know what
data rate was set in INS unit.
“INS visualization” tab consists from two vertical parts. Visualization panel of
the INS outputs is situated on the left part of the tab. The right part displays
text data from INS and additional information; the right part is the same for
all visualization styles.
“Start“ button starts the INS with parameters saved in the INS
microprocessor. Next initial alignment of the INS is performed with displayed
message “Initial alignment. Please wait”. Also a progress bar of initial
alignment will appear in the status line of the main window. During the initial
alignment the INS has to be unmovable relative to the Earth. Once the initial
alignment time is over, observe changes in numeric data and graphical
evolutions of the object.
Note. For visual convenience of the INS position perception displayed on the monitor and
the INS real position, it is recommended to place the INS in parallel with the monitor
before the beginning of work as follows: direct lateral axis X to the monitor and direct
longitudinal axis Y in parallel with the monitor on the left.
Once the “Start” button is pressed, buttons “Stop” ,“Write” ,
“Snapshot” and “Start/Stop VG3D clb” become active. If in the menu
“Test Options” the data output method “On Request“ is chosen, then button
“Request” becomes active too.
Upon clicking the “Write” button the measured data are saved, which is
signified by the message “Data are writing in file!” in the text part of the
 Loading...