INS
GUI User’s Manual
Inertial Labs, Inc
TM
Address: 39959 Catoctin Ridge Street, Paeonian Springs, VA 20129 U.S.A.
Tel: +1 (703) 880-4222, Fax: +1 (703) 935-8377 Website: www.inertiallabs.com
74
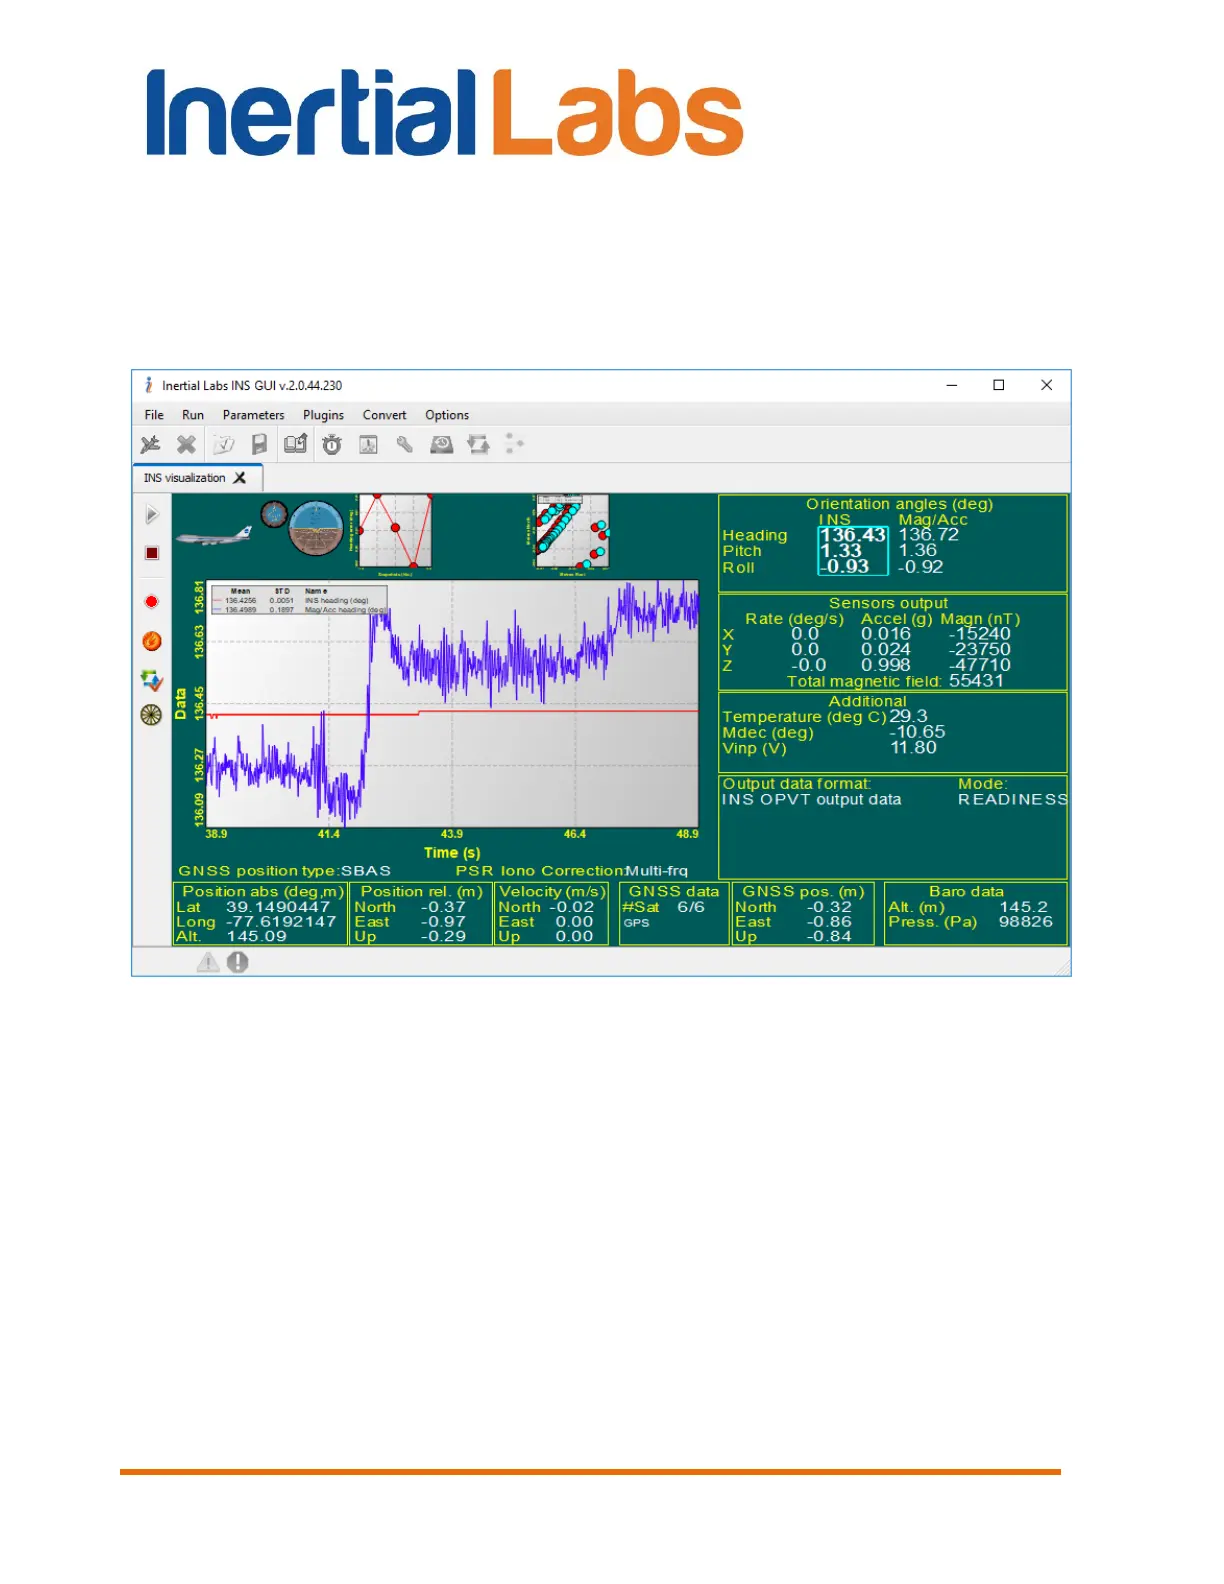
5.4. Data graphs style of visualization
“Data graphs” window allows to show graphs of current INS outputs (see
Fig. 5.5). To switch visualization to this mode click on preview shown in the
Fig. 5.2 (d) and window shown in the Fig. 5.5 will appear.
Fig. 5.5
It is possible to select the signals you want to display by right-click on the
graphs area. As a result window shown in the Fig. 5.6 will appear.
You can select or deselect signals by clicking on their titles:
- INS heading (deg) – plots Heading angle calculated in the INS, in
degrees;
- INS pitch (deg) – plots Pitch angle calculated in the INS, in degrees;
- INS roll (deg) – plots Roll angle calculated in the INS, in degrees;
 Loading...