DACS-W Operation Manual 5 NORMAL OPERATIONS & FUNCTIONS
5-13
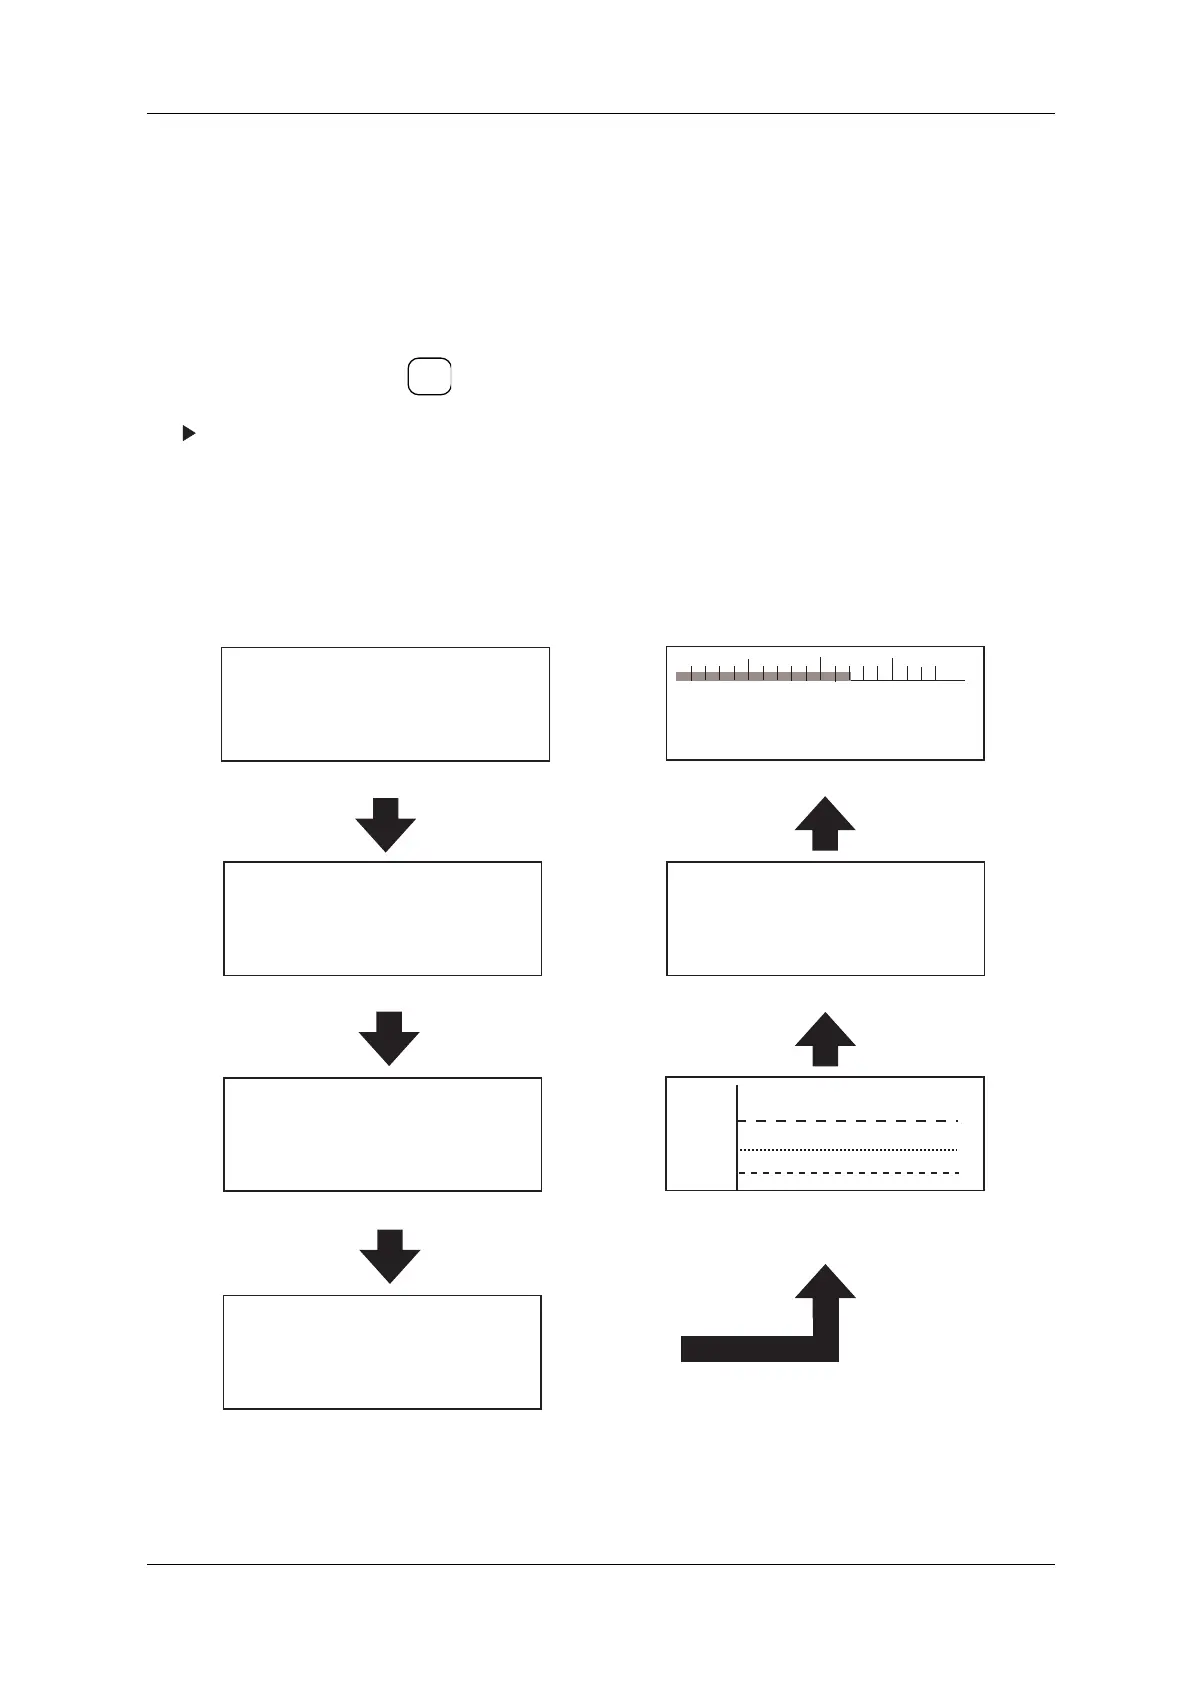
5.5.4 Data Displays
This item is used to change the display in the Standby/Product menu. Weight Value Zoom, Total Count
Zoom, Actual Speed Zoom, Histogram Display, X-Bar Chart Display, last 27 Weight Data Display and
Bar Graph Display can be viewed in the Operator mode during production.
To view this production data, follow the procedure shown below.
Figure 5-19 production data displays
1. During production, press .
The Status displays change in the following
order: [Weight Value Zoom ] → [Total Count
Zoom] → [Actual Speed Zoom] →
[Histogram] → [X-Bar Chart] → [Last 27
Weight Data] → [Bar Graph].
INFO
0
47.0g
0.0g
pcs/min
44.0:
45.0:
46.0:
47.0:
48.0:
49.0:
50.0:
51.0:
REFER.WT:
PROPER COUNT:
OVER COUNT:
UNDER COUNT:
TOTAL COUNT:
TOTAL WT:
MEAN WT:
STANDARD D:
47.0 g
126 pc
99 pc
0 pc
225 pc
10.9 kg
48.5 g
1.395 g
X-bar Chart
48.0g
47.0g
46.0g
[Last 27 Weight Data]
48.0 48.2 47.0 47.5
47.1 49.5 47.4 48.7
47.0 48.2 47.1 47.5
48.0 47.2 47.4 47.6
48.1 48.6 48.8 47.3
47.0 47.2 47.9 47.9
48.1 48.6 47.2
0.0
g
47.0g
225pc
225
pc
47.0g
0.0 g
101.2g
No.0
-3.0g 100.0g
+3.0g
Proper
FIGURE 5-19: WEIGHT VALUE ZOOM
TOTAL COUNT ZOOM
FIGURE 5-21: ACTUAL SPEED ZOOM
FIGURE 5-22: HISTOGRAM DISPLAY
FIGURE 5-23: X-BAR CHART DISPLAY
FIGURE 5-24: LAST 27 WEIGHT DATA DISPLAY
FIGURE 5-25: BAR GRAPF DISPLAY
FIGURE 5-20: