5 NORMAL OPERATIONS & FUNCTIONS DACS-W Operation Manual
5-16
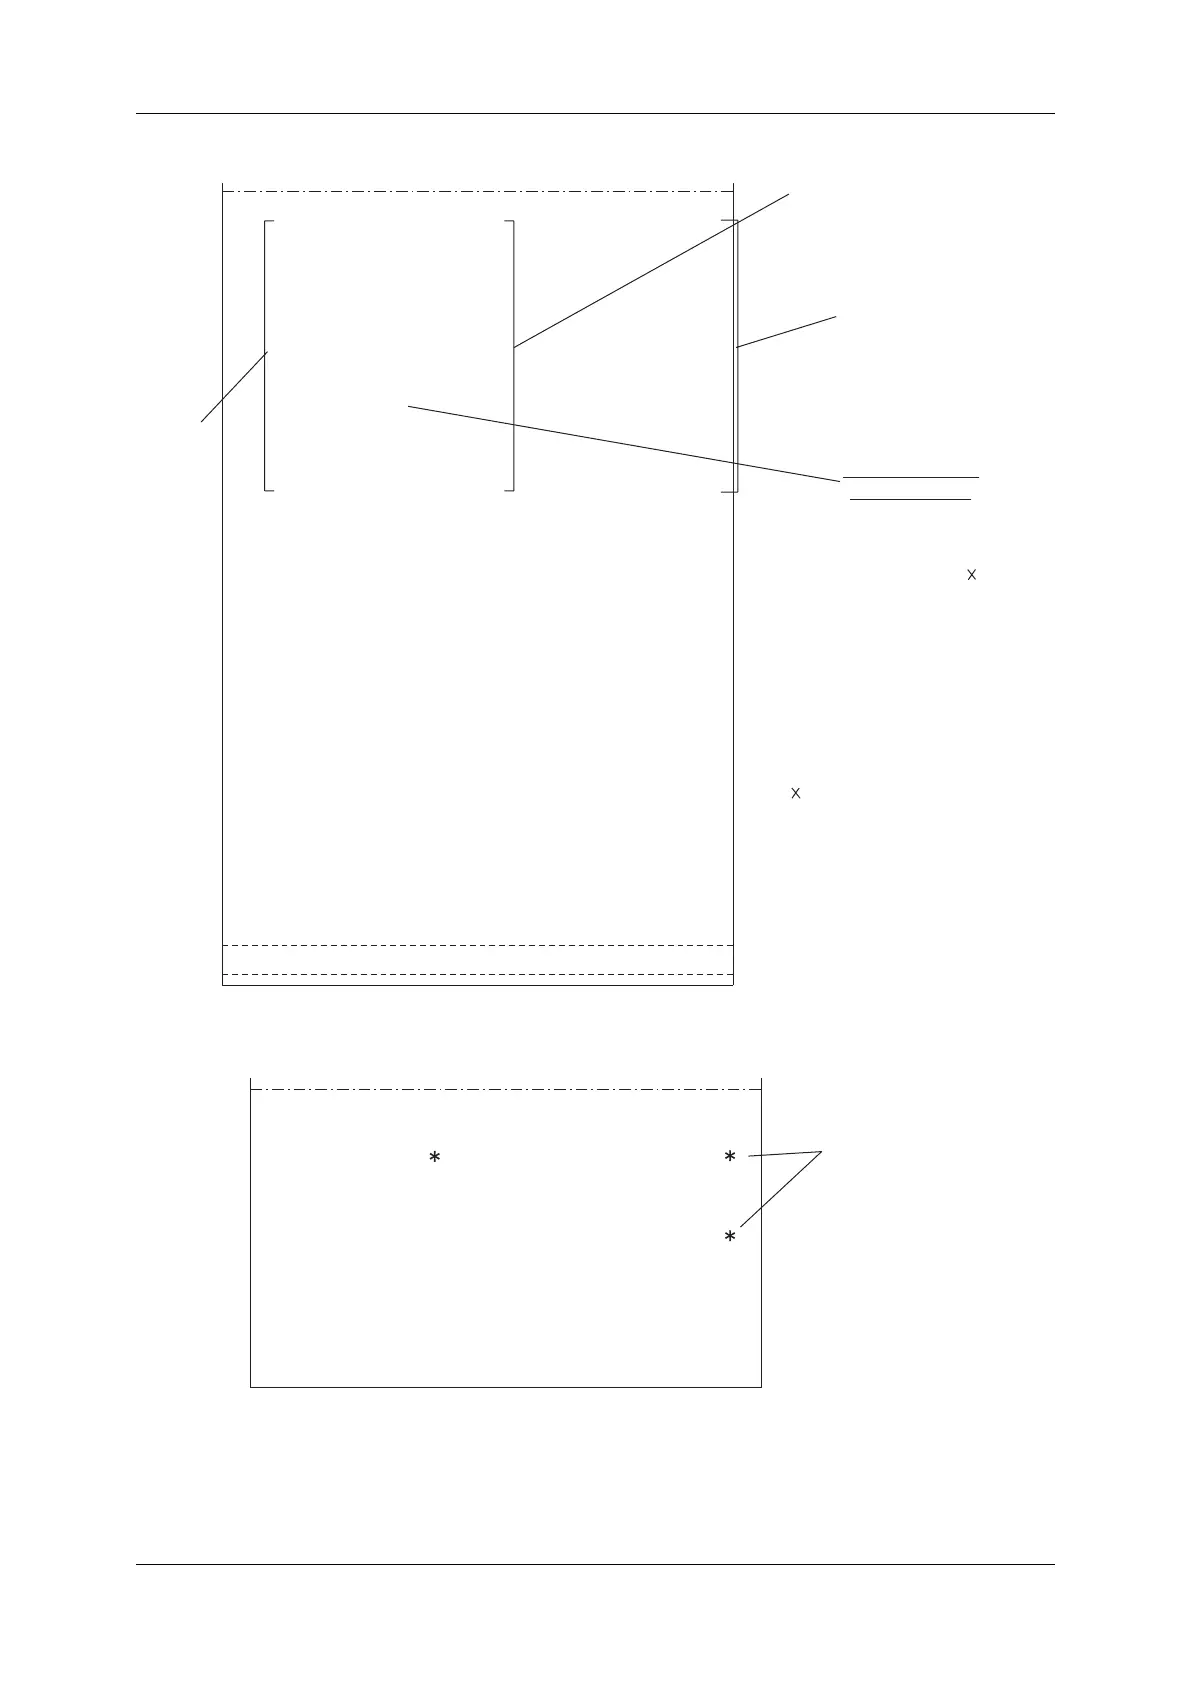
Figure 5-28 All Lot Total Sample
Figure 5-29 Pack Weight Log Sample
READING THE
HISTOGRAM
Number of packs in each
zone is calculated by :
(histogram unit (X))
[(Number of X)+(the last
digit/10)]
E.G.,
97.5 3 2
98.0 X8 11
98.5 XX3 14
99.0 XXXX*8 35
99.5 XXXX*XX0 42
100.0 XXXX*XX3 44
100.5 XXXX*XX1 43
101.0 XXXX1 25
101.5 XX5 15
102.0 3 2
102.5 3 2
103.0 1 1
103.5 0 0
104.0 0 0
X= 6
RANGE 6.4g
MIN. WT: 97.0g
MAX. WT: 103.4g
STANDARD D: 0.998g
MEAN WT: 100.0g
TOTAL WT: 23.6kg
TOTAL COUNT: 236pc
UNDER COUNT: 27pc
OVER COUNT: 37pc
PROPER COUNT: 172pc
TOTAL ITEMS ALL
LOWER LIMIT - 1.0g
UPPER LIMIT + 1.0g
REFER. WT: 100.0g
CODE: 1111
NAME: POTATO CHIPS
PRESET NUMBER: 1
TOTAL NUMBER: 1
TOTAL END: 11
45
TOTAL START: 10 44
DATE: 1997-JAN-11
TOTAL DATA
Number of packs in
each zone is
represented by the
histogram-type graph.
Pack count
W
e
ight
ranges
in the printout at right,
the histogram unit value is
6:(X=6) and the 99.0 zone
is shown as 99.0 xxxx*8
The number of packs in the
99.0 zone is calculated by :
(6) [(5)+(8/10)]=35
packs
The asterisk (*) mark which
appears every 5th X is
used to improve readability
of long rows, and is counted
as a histogram unit.
:
:
21 101.0 99.4
19 99.2 100.1
17 98.7
101.4
15 100.5 99.4
13 99.7 100.5
11 99.0 99.4
9 100.4 98.7
7 100.5 100.6
5 100.4 101.6
3 99.6 99.7
1 99.5 99.5
1997-JAN-11 10:43
START PACK WEIGHT LOG
OVER, UNDER
WEIGHT DATA