OMRON CHAPTER 4 – Objects
Release 2.0 Page 51
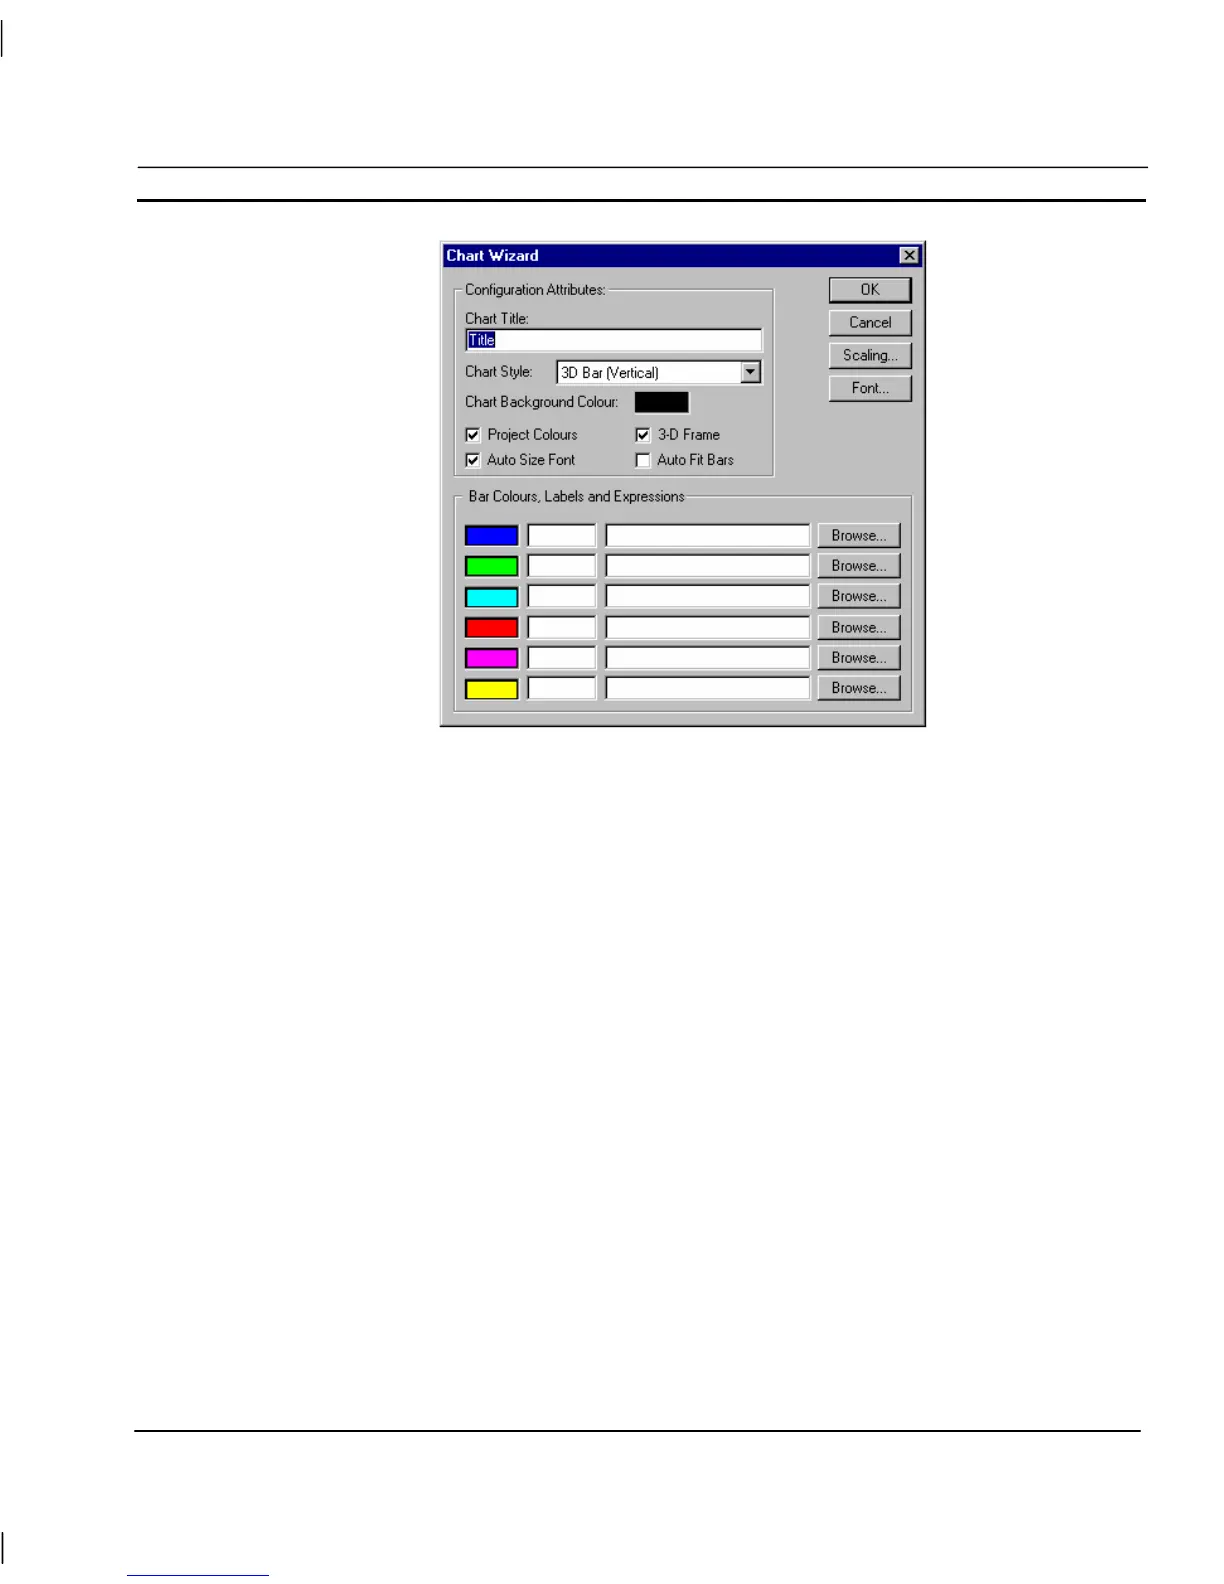
The Chart Wizard allows entry of configuration attributes and assignment of expressions.
1, 2, 3…
1. Enter a title for the chart in the Chart Title: field.
2. Select the chart style from the Chart Style: field.
3. Select the colour of the chart background.
4. Toggle the Project Colours, 3-D Frame and Auto Fit Bars fields as desired.
The Project Colours option allows the user to change the colour of the axis
using the toolbox. The 3-D Frame option enables the chart to appear with a
3-D frame. The Auto Fit Bars option forces the configured bars to resize
themselves to occupy all of the available chart area.
5. Change the fonts used for the chart via the Font pushbutton. The font size
used for the chart can be automatically calculated by selecting the Auto Size
Font option.
6. Enter an arithmetic trace expression for each point or select one by clicking
on a Browse pushbutton. An existing point can also be associated with the
Wizard by dragging a point directly from the Point Editor. Refer to chapter
3, Points regarding adding a new point and dragging from the Point Editor.
7. Exit the Wizard by clicking the OK pushbutton to accept the new chart
attributes, or click the Cancel pushbutton to leave the chart unchanged.
To select the chart scaling, click the Scaling pushbutton; the Axis Scaling dialog is displayed as
follows: