OMRON CHAPTER 4 – Objects
Release 2.0 Page 61
Trend Graph
Trend graphs allow the display of data over time. Click the Trend Graph button, then click
or click and drag on the page to insert the graph.
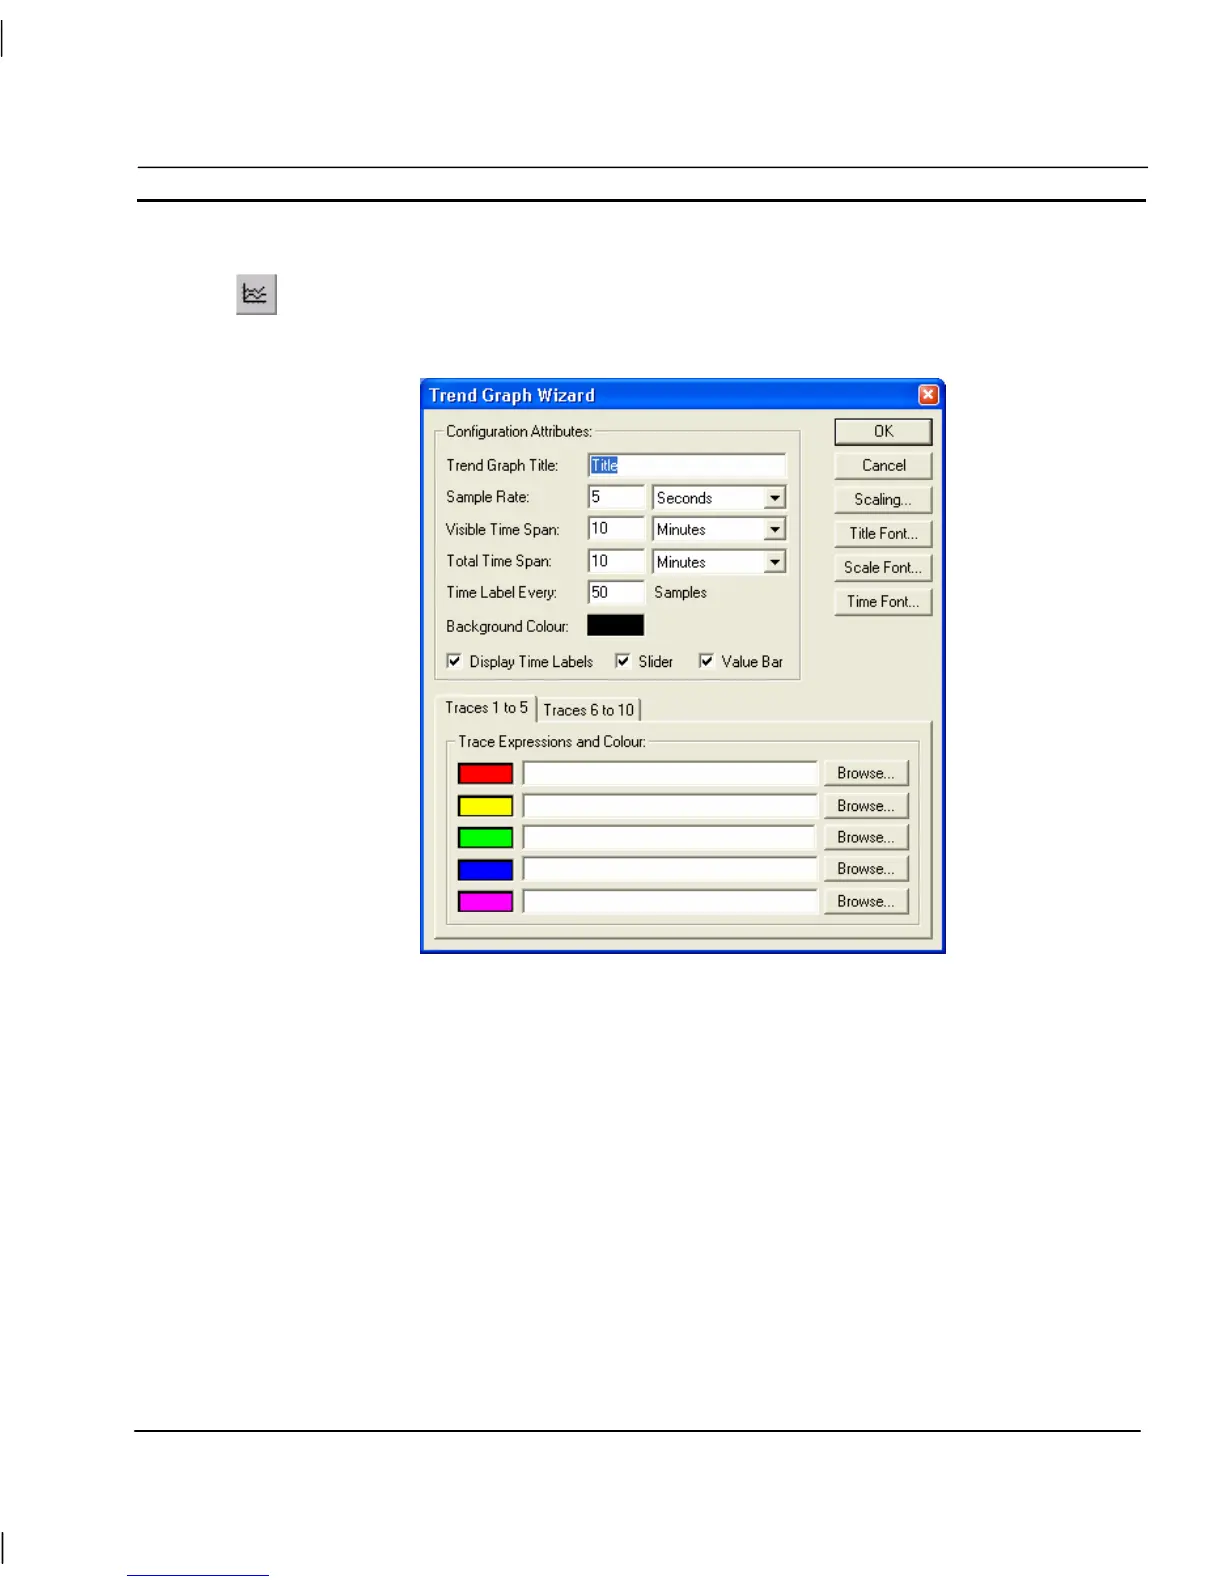
To edit the Trend Graph, double click on it. The Trend Graph Wizard dialog is displayed as follows:
The Wizard allows entry of Configuration Attributes: and assignment of line colours and expressions.
1, 2, 3…
1. Enter a title for the graph in the Trend Graph Title: field.
2. Enter the frequency of data sampling in the Sample Rate: field, in this
example it is every five seconds.
3. Enter the period displayed by the graph at any one time in the Visible Time
Span: field.
4. Enter the size of buffer for stored data of samples in the Total Time Span:
field.
5. Enter the number of samples on the X-axis in the Time Label Every: field.
6. Click on the background colour and select the required colour from the
palette.