USTER®
HVI 900
Instruction Manual
Uster Technologies, Inc.
Chapter 8
Version 4.0 (1.99) 940 DataManager - Page 8-20
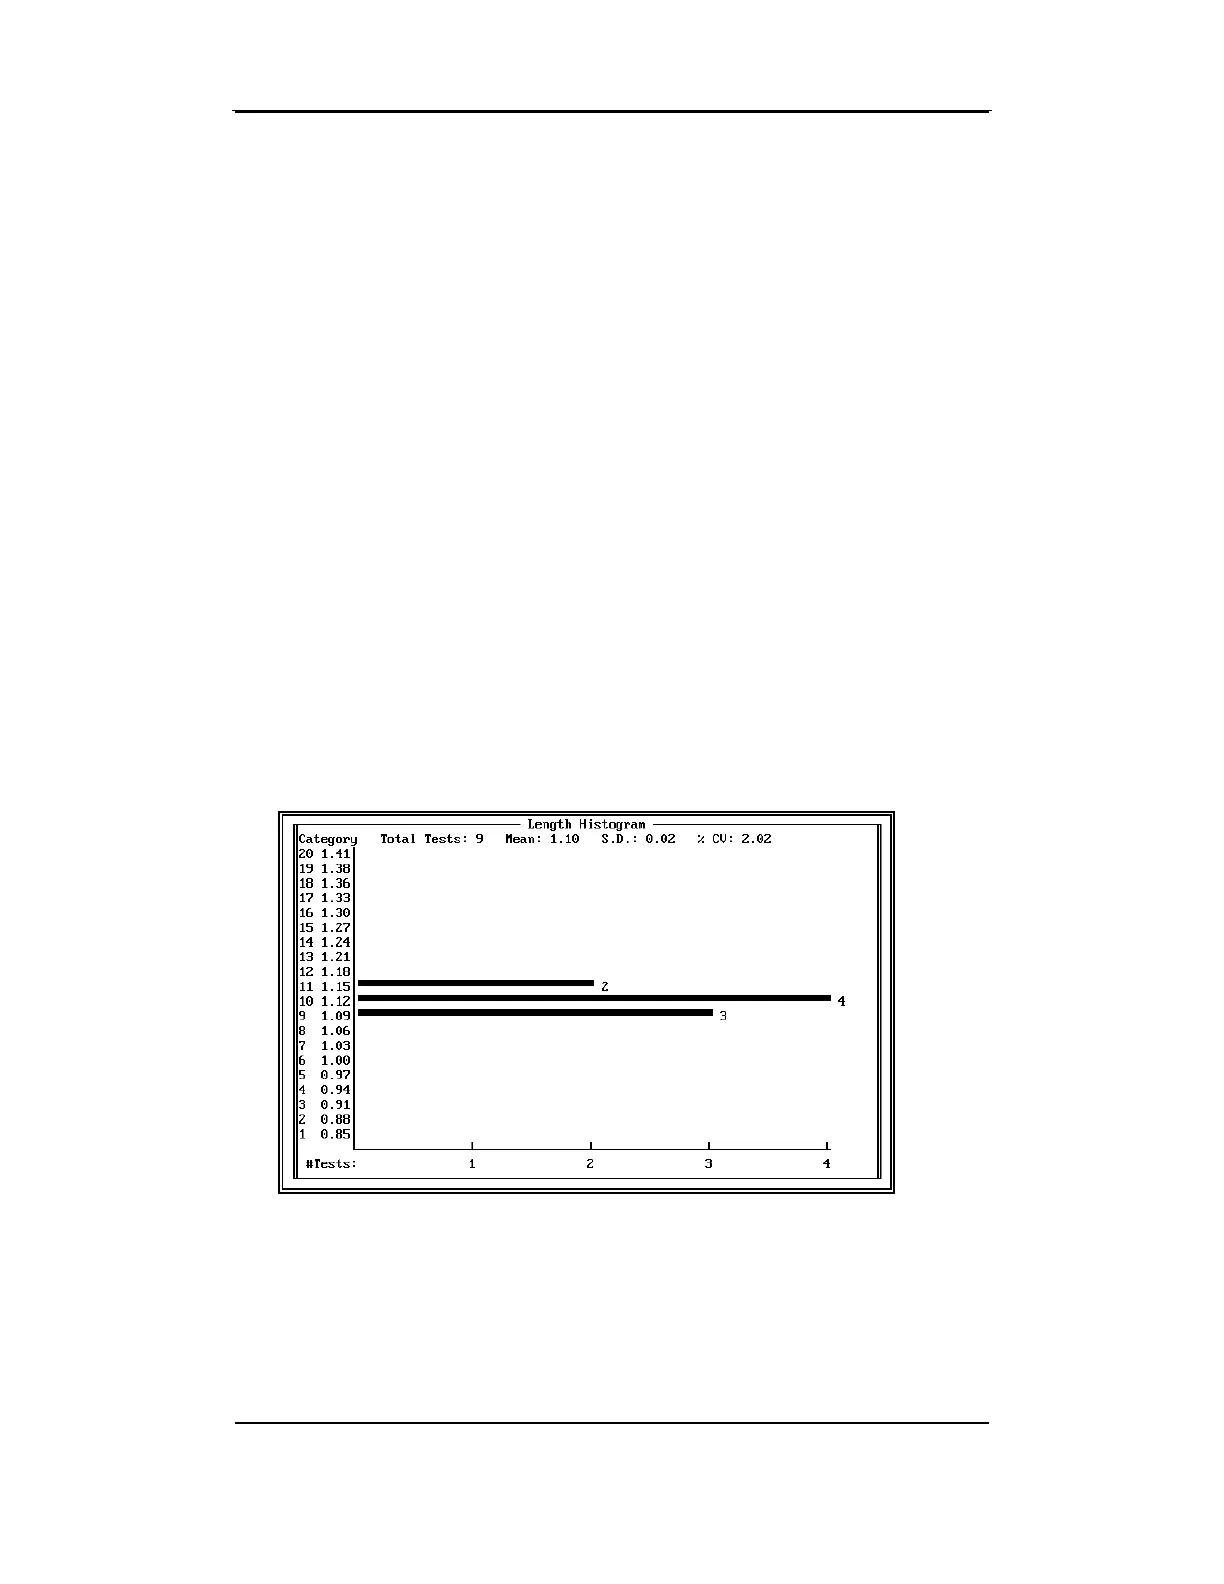
5.7 Make Histogram
When you select
Make Histogram
, the parameters selected will be used
to compose the histogram, which will display on the monitor. The
category numbers and category midpoints for the property being plotted
appear on the Y-axis in ascending order. The number of tests is on the
X-axis. The total number of tests, average, standard deviation, and %
C.V. are listed across the top of the histogram.
• After you have completed viewing the histogram, press ESCAPE.
• A window will display with the options to print the histogram and/or
exit the report.
• Print Histogram—The histogram that was displayed is printed.
The printout contains the Property name, time, date, company name,
and the identifiers used for the histogram. You must have an Epson
compatible printer that has been set to display the IBM graphics
character set for the histogram to print.
•
Exit—Returns to the HISTOGRAM MENU window. (ESCAPE also
returns to the H
ISTOGRAM MENU).
 Loading...