6.2 Explanation of Windows
6-15
6
How to Operate Sampling Scope
Figure 6.2.2-2 Example of How Corrected Measurement Results are
Displayed
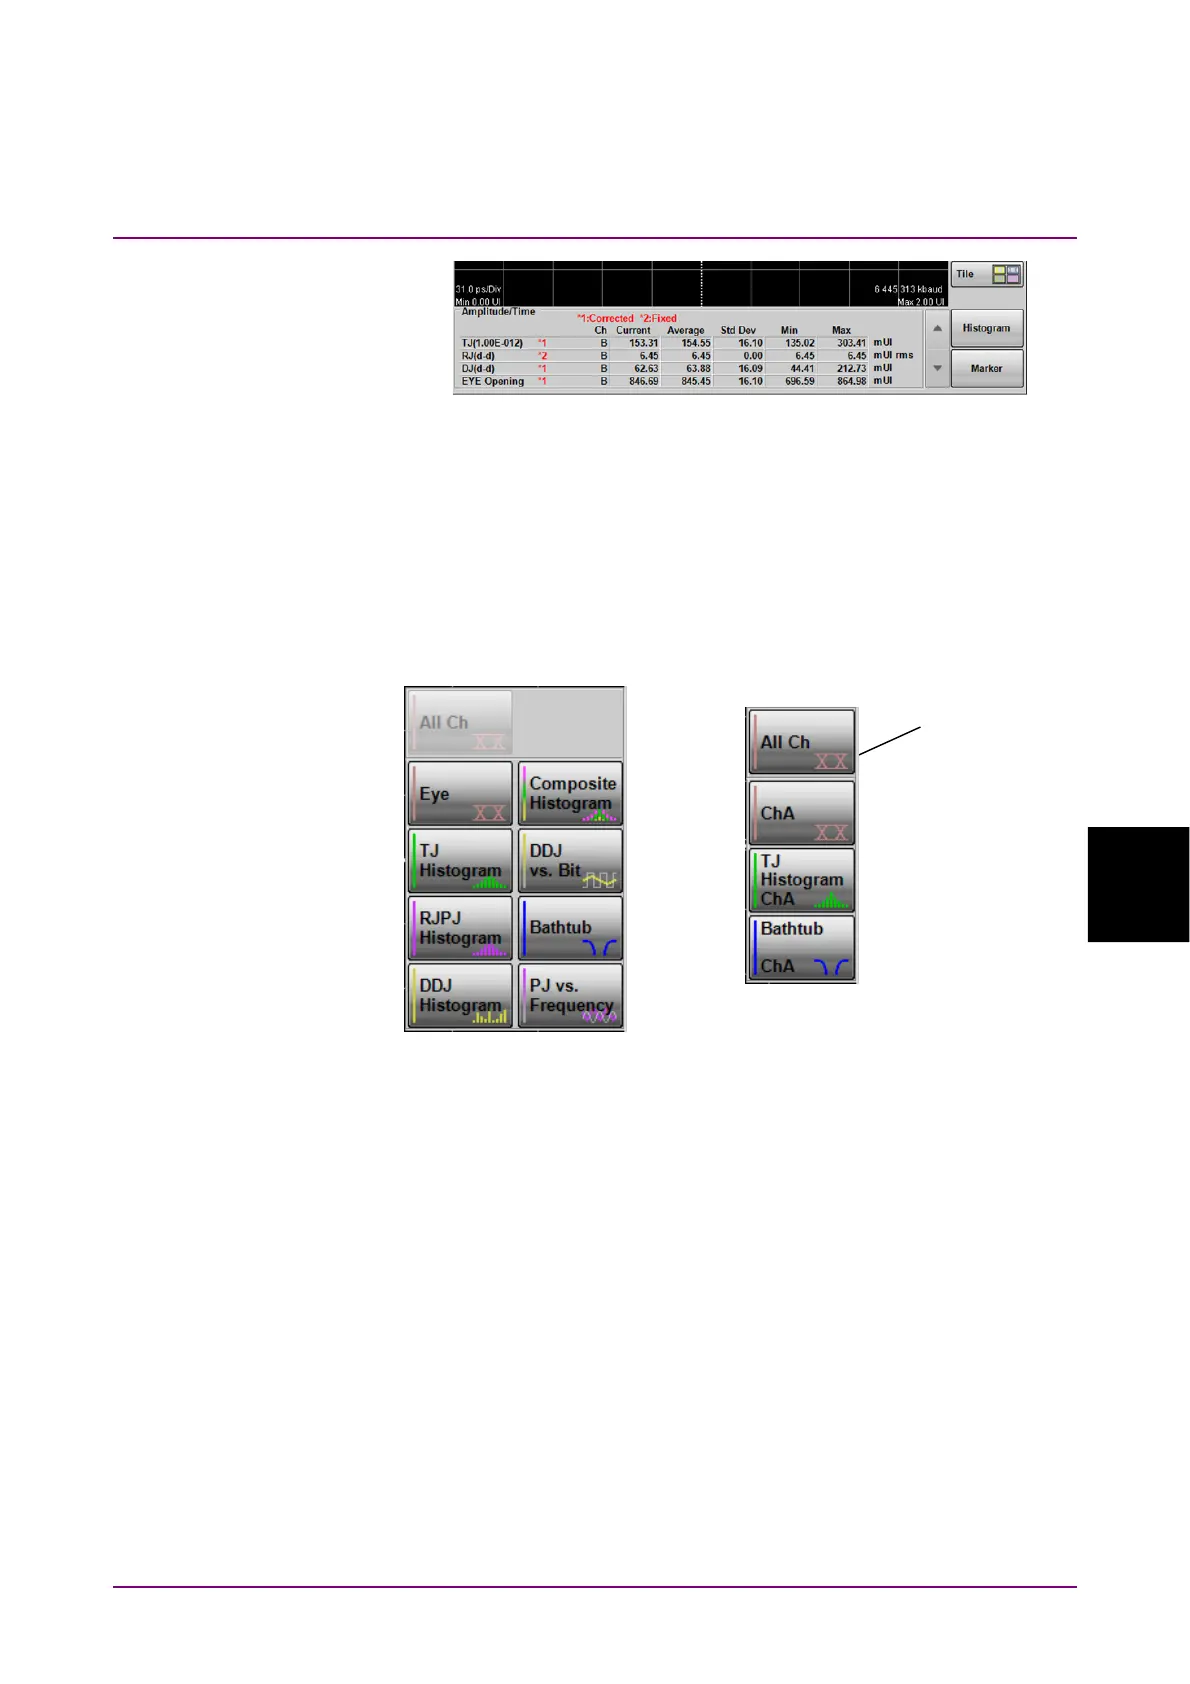
Displaying Graphs
When Graph in the Result window is clicked, Graph selection buttons
appear and the graph to display can be selected.
When Sampling Mode is Eye, the active channel is displayed on the
button.
Figure 6.2.2-3 Examples of Graph selection buttons
The graph can be switched between enlarged display and reduced (four
screens) display.
To switch the display size of the graph, click Single or Tile.
Eye
Advanced Jitter
Graph selection
buttons