6.9 Measuring Waveform
6-111
6
How to Operate Sampling Scope
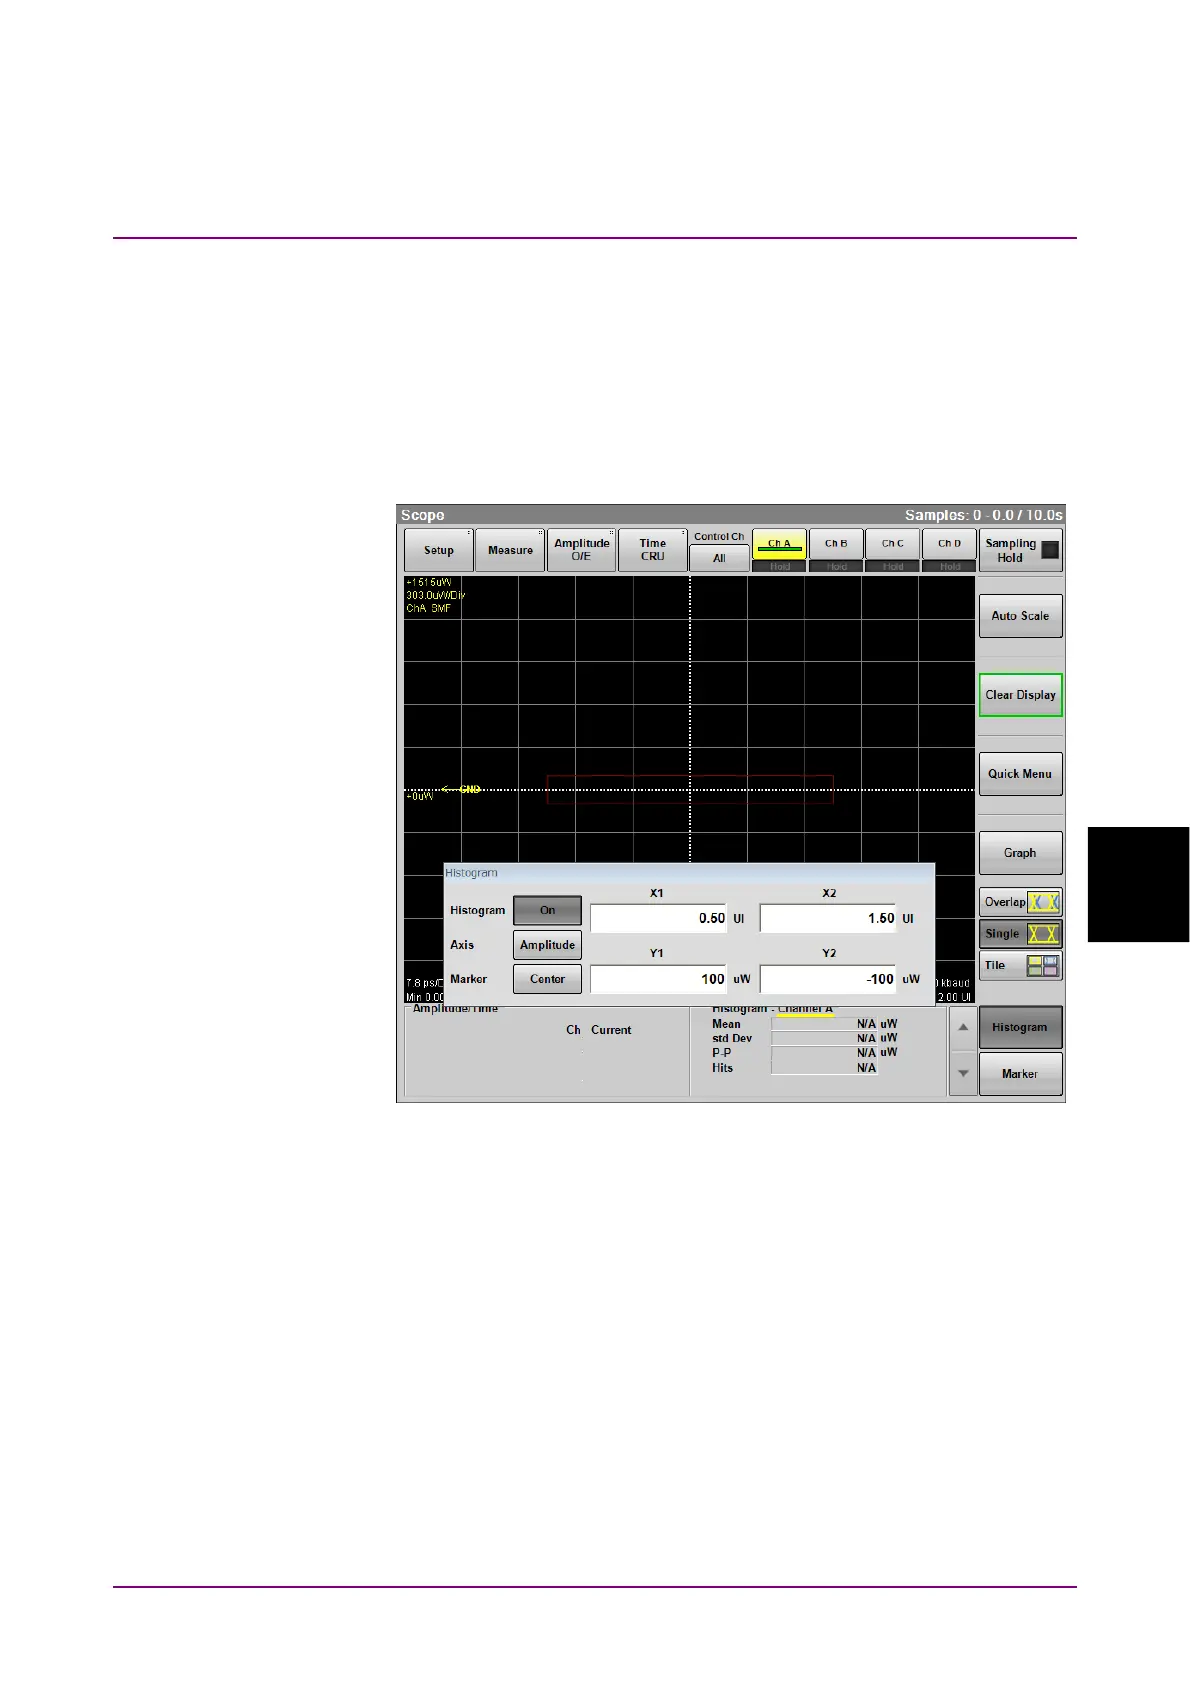
6.9.4 Measurement Using Histogram
The histogram display displays the data distribution in the set field to
measure the mean, standard deviation, and dispersion width.
To display histogram, set the axis, time, or amplitude for measuring
histogram. And then, set the screen area to display histogram using the
histogram marker. Also, the histogram marker position can be set by
clicking the screen or using the mouse.
Figure 6.9.4-1 Setting Example of Histogram Measurement