Chapter 1 Outline
1-22
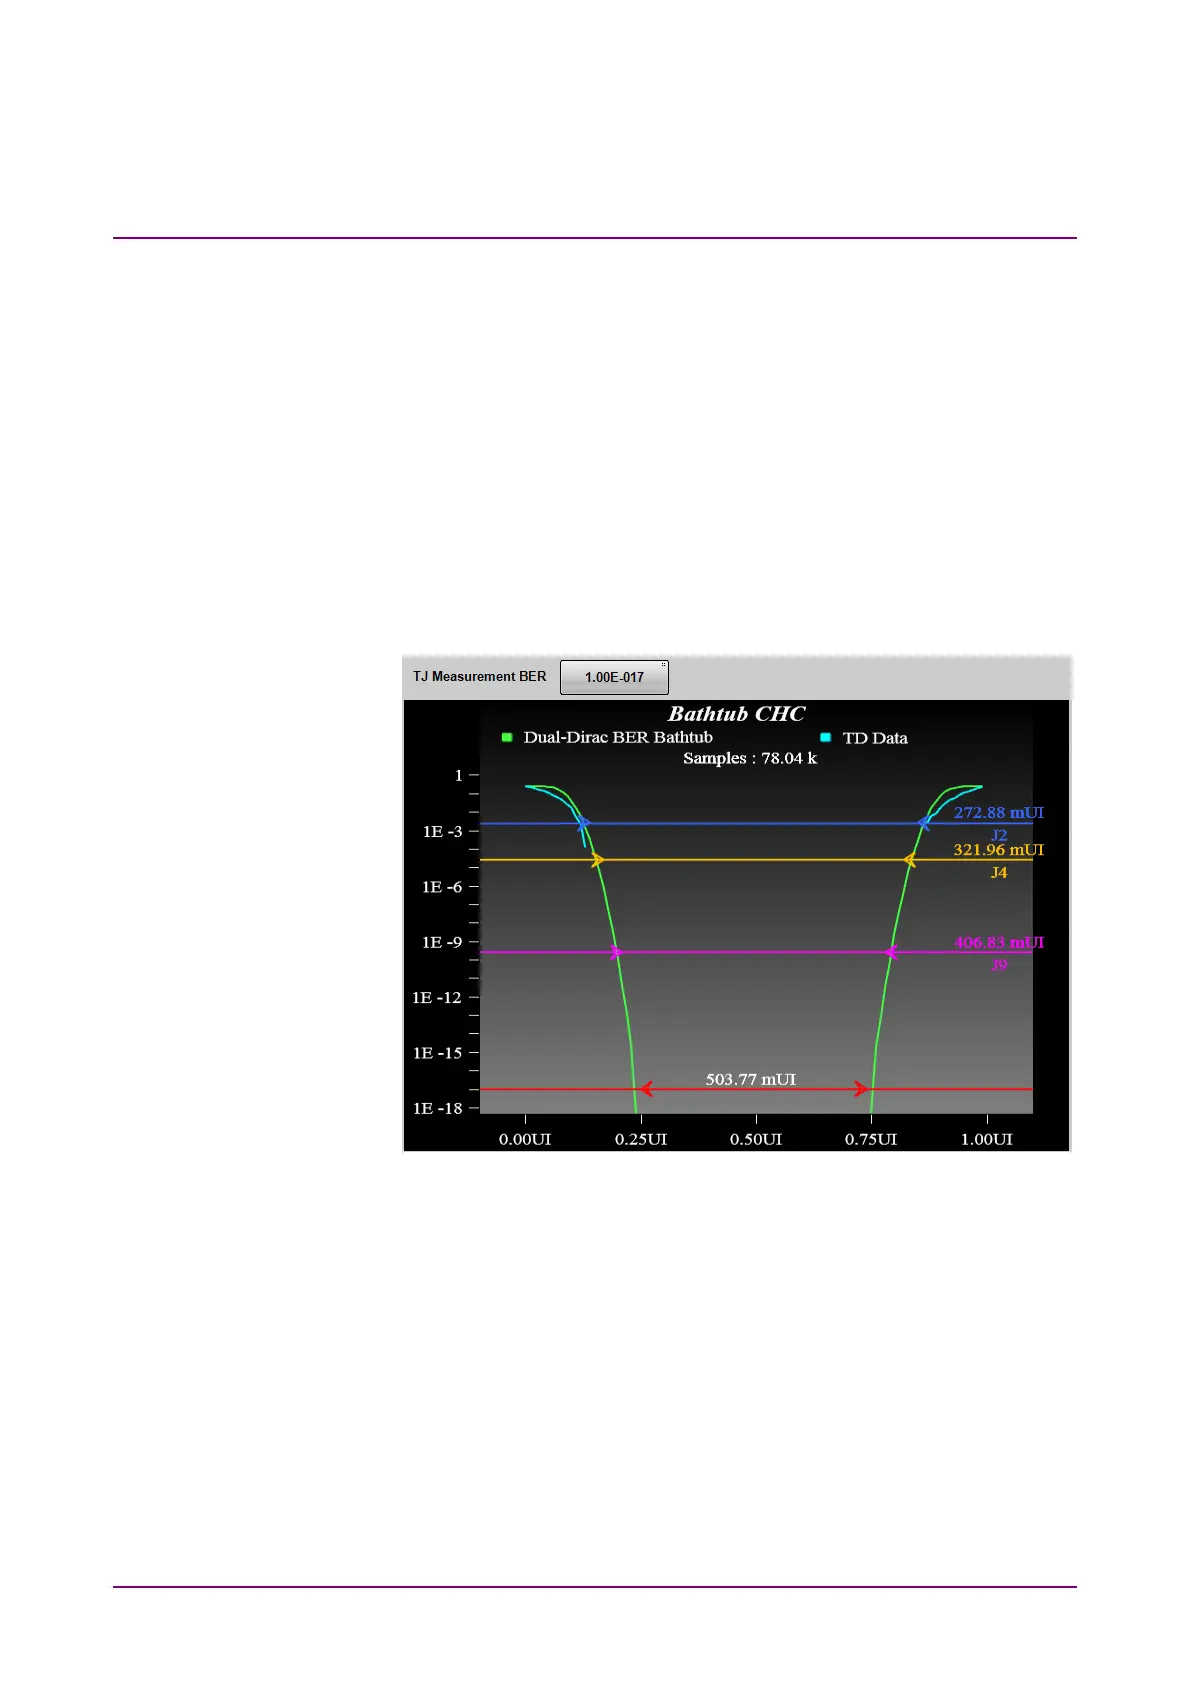
Bathtub
As an evaluation method of eye pattern waveform, there is a graph that
displays the measurement result with time as the horizontal axis and bit
error rate as the vertical axis. The left and right edges of the graph are
the positions of the cross points of the eye pattern waveform, and have
large bit error rates. The center part of the graph is the center part of the
eye pattern waveform, and has small bit error rate. This graph is called a
Bathtub graph or Bathtub curve line from the form of the graph.
The Jitter analysis software displays the bathtub graph estimated from
the histogram of total jitter. The software displays the time with 99%
jitter (J2) BER, 10
-4
jitter (J4), 10
-9
jitter (J9) specified in the
communication standards, and the specified bit error rate such as 10
-12
or
less.
Figure 1.5-3 Example of Bathtub Curve