CDM-840 Remote Router MN-CDM840
Ethernet-based Remote Product Management Revision 3
6–77
To initialize the page: Select the Time Span for the graphs as 20 minutes, 3 Days, or 30 Days.
Then, select Auto Update if you wish to set the trending data refresh interval from the default
of 10 minutes to 5 seconds. Click [Update] to execute your selection. Allow a few seconds for
the graphs to visually update.
Traffic Throughput (kbps) Graph
This graph displays utilization of the available data traffic types:
Data Traffic Type Description
WAN data rate associated with E1/RAN traffic.
WAN IP WAN data rate associated with IP traffic.
WAN Total WAN data rate total (WAN E1 + WAN IP).
E1 Ingress Data rate of E1 time slots carried (64K * number of time slots).
Traffic Ether Ingress Data rate of Ethernet traffic (WAN/E1 ingress utilization).
Modem transmit data rate.
Select as many or as few of the applicable types from the legend to the right of the graph. Allow
a few seconds for the graph to display the selected traffic data types.
RAN Link Quality Graph
This graph provides the performance indicator for the Tx RAN Link Quality metric, a qualitative
measure of the voice quality predicated by a) the level of compression, and b) traffic packet
optimization required to accommodate the incoming traffic into the available WAN (satellite)
bandwidth.
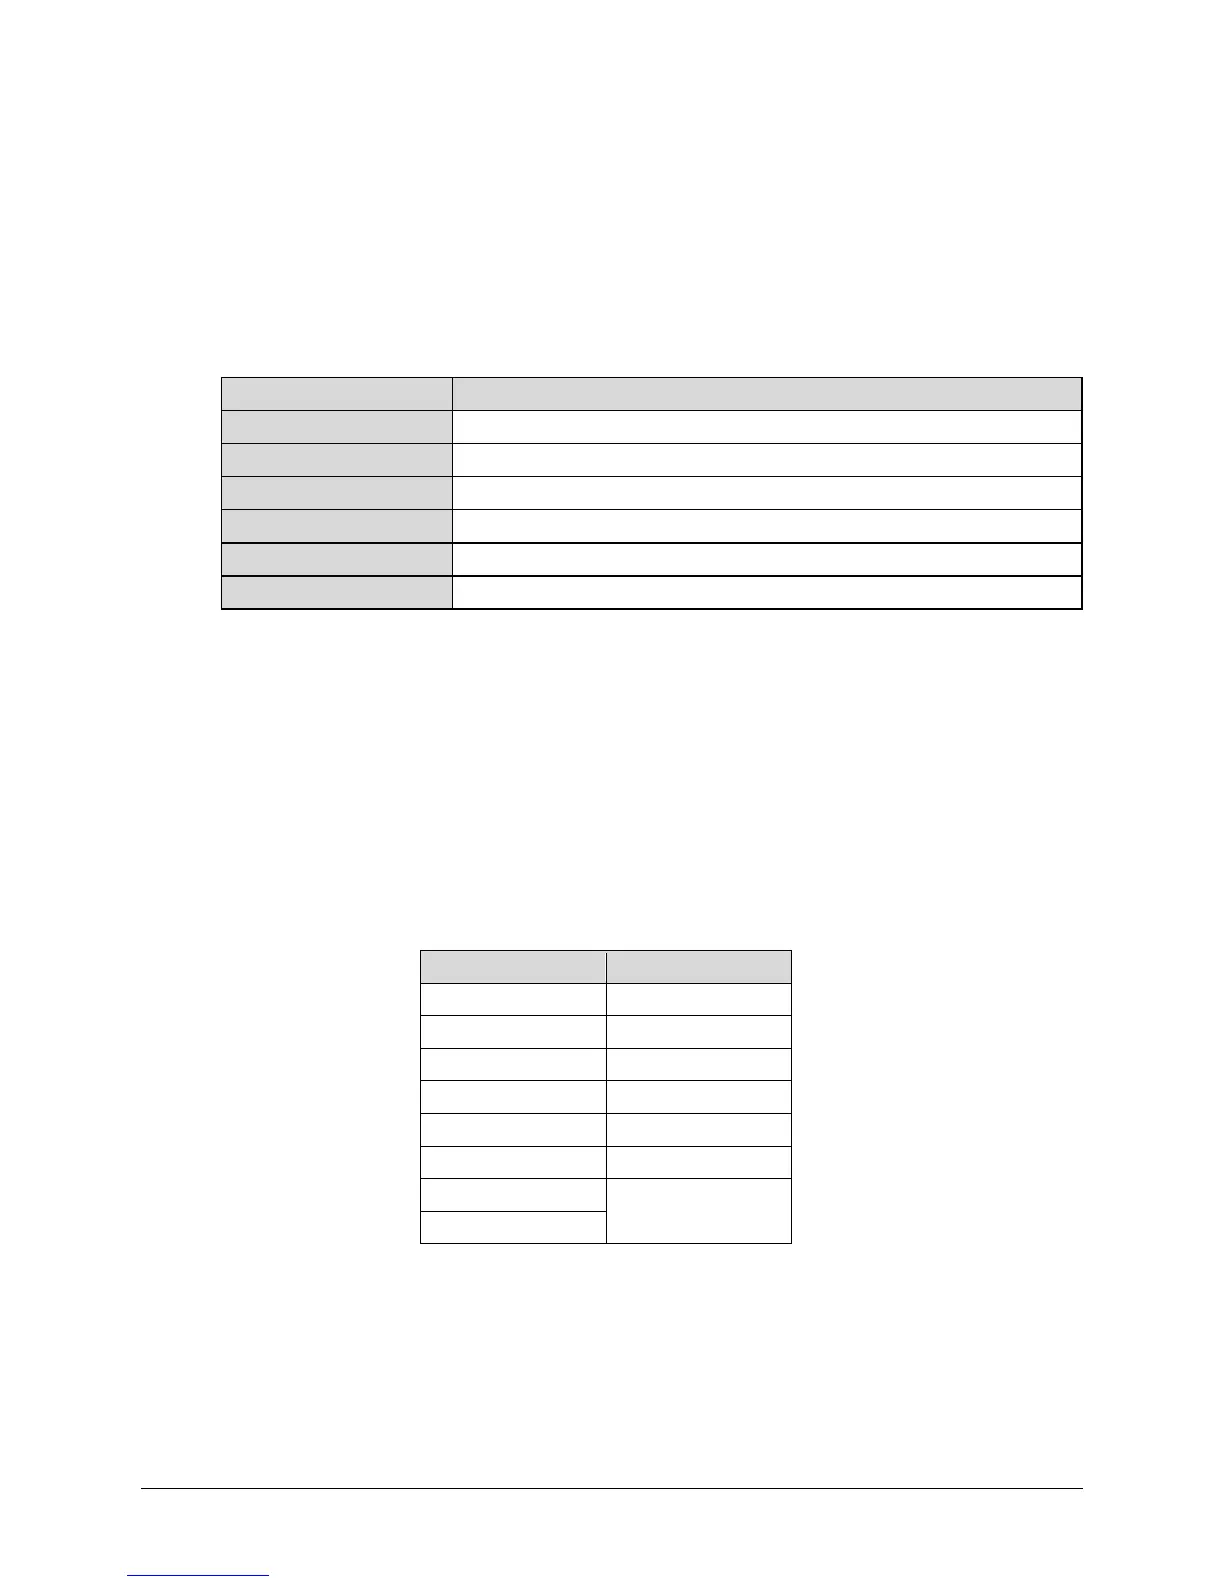
Association of the Link Quality Metric to its comparative Link Quality is as follows:
8 Excellent
7 Very Good
5 Fair
4 Average
2
Very Poor
1
Note that ‘8’ on the graph indicates the highest quality, with no voice traffic optimization.
RANOp Savings Graph
This graph provides the performance indicator for Tx RAN Optimization on the actual
“percentage of savings” basis.