CDM-840 Remote Router MN-CDM840
Appendix K Revision 3
K–11
Association of the Link Quality Metric to its comparative Link Quality is as follows:
Link Quality Metric Link Quality
8 Excellent
7 Very Good
6 Good
5 Fair
4 Average
3 Poor
2
Very Poor
1
Note that ‘8’ on the graph indicates the highest quality, with no voice traffic discard.
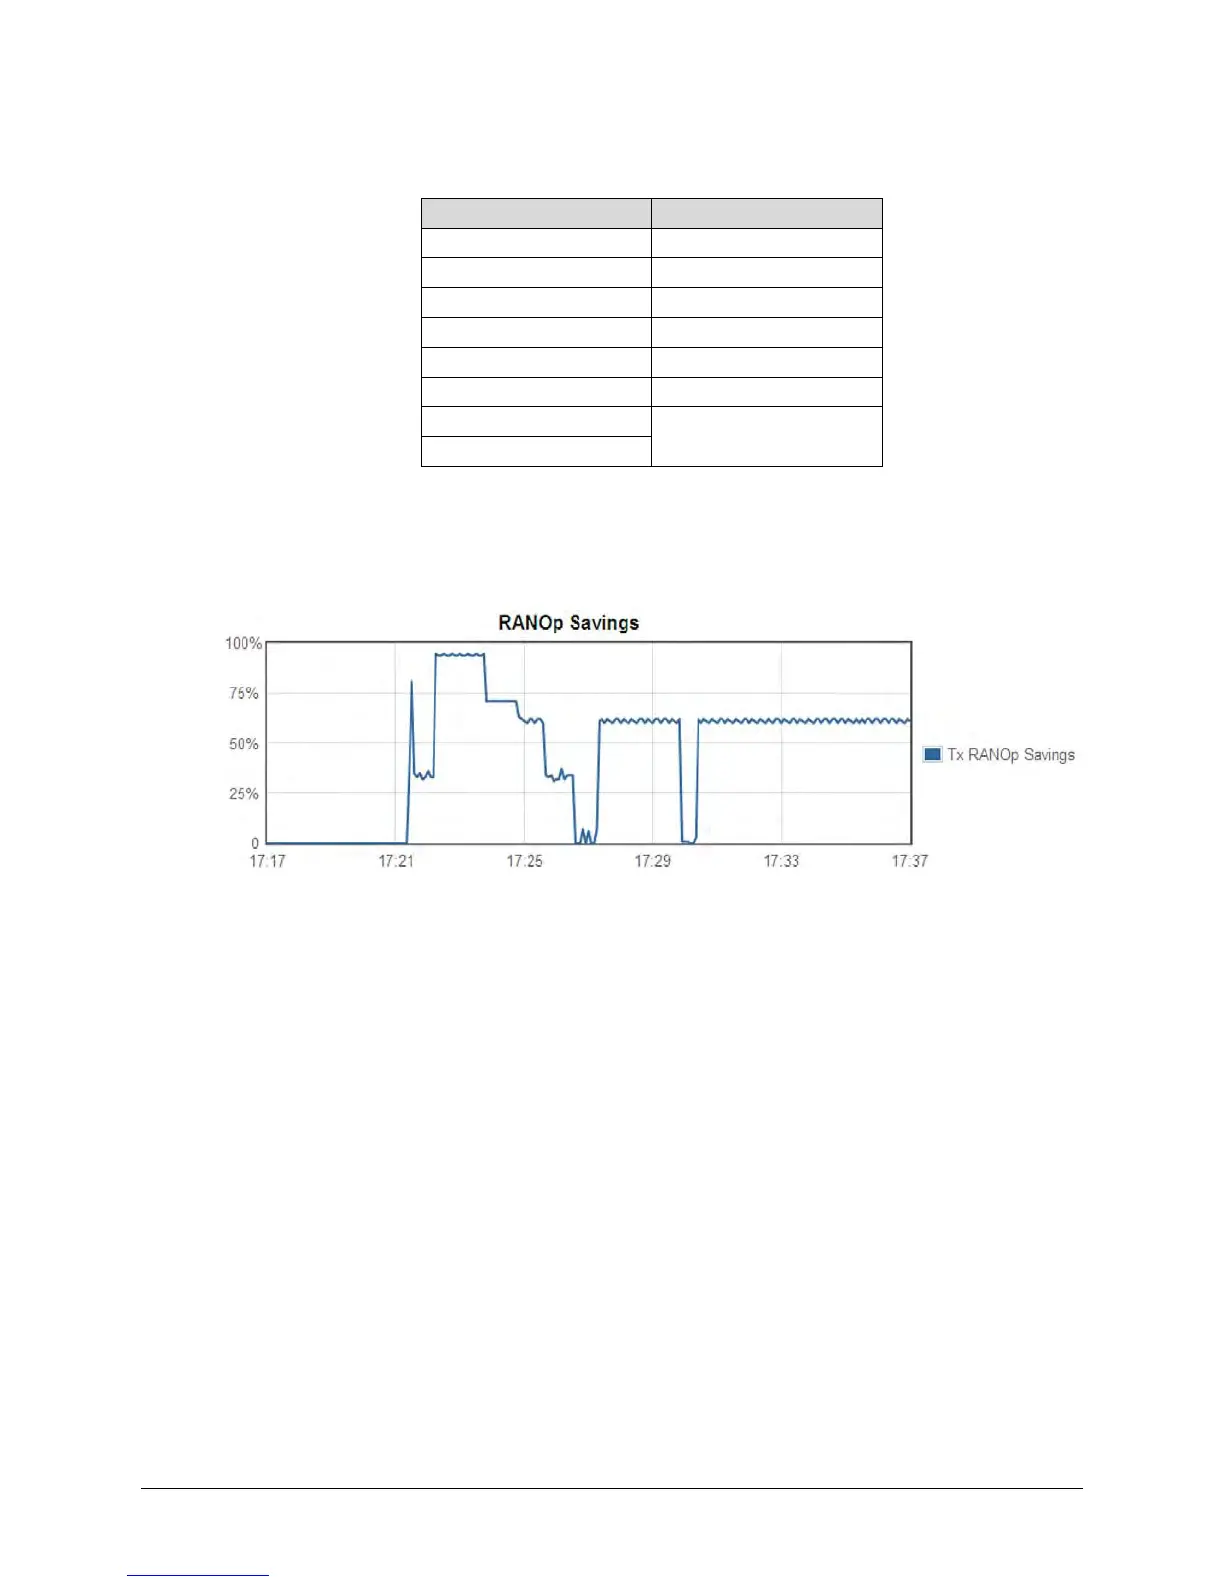
K.2.2.1.3 RANOp Savings Graph
This graph illustrates the performance indicator for Tx RAN Optimization on an actual
“percentage of savings” basis over the chosen time span. This example shows the graph with the
20-minute time span selected.