CDM-840 Remote Router MN-CDM840
Appendix K Revision 3
K–10
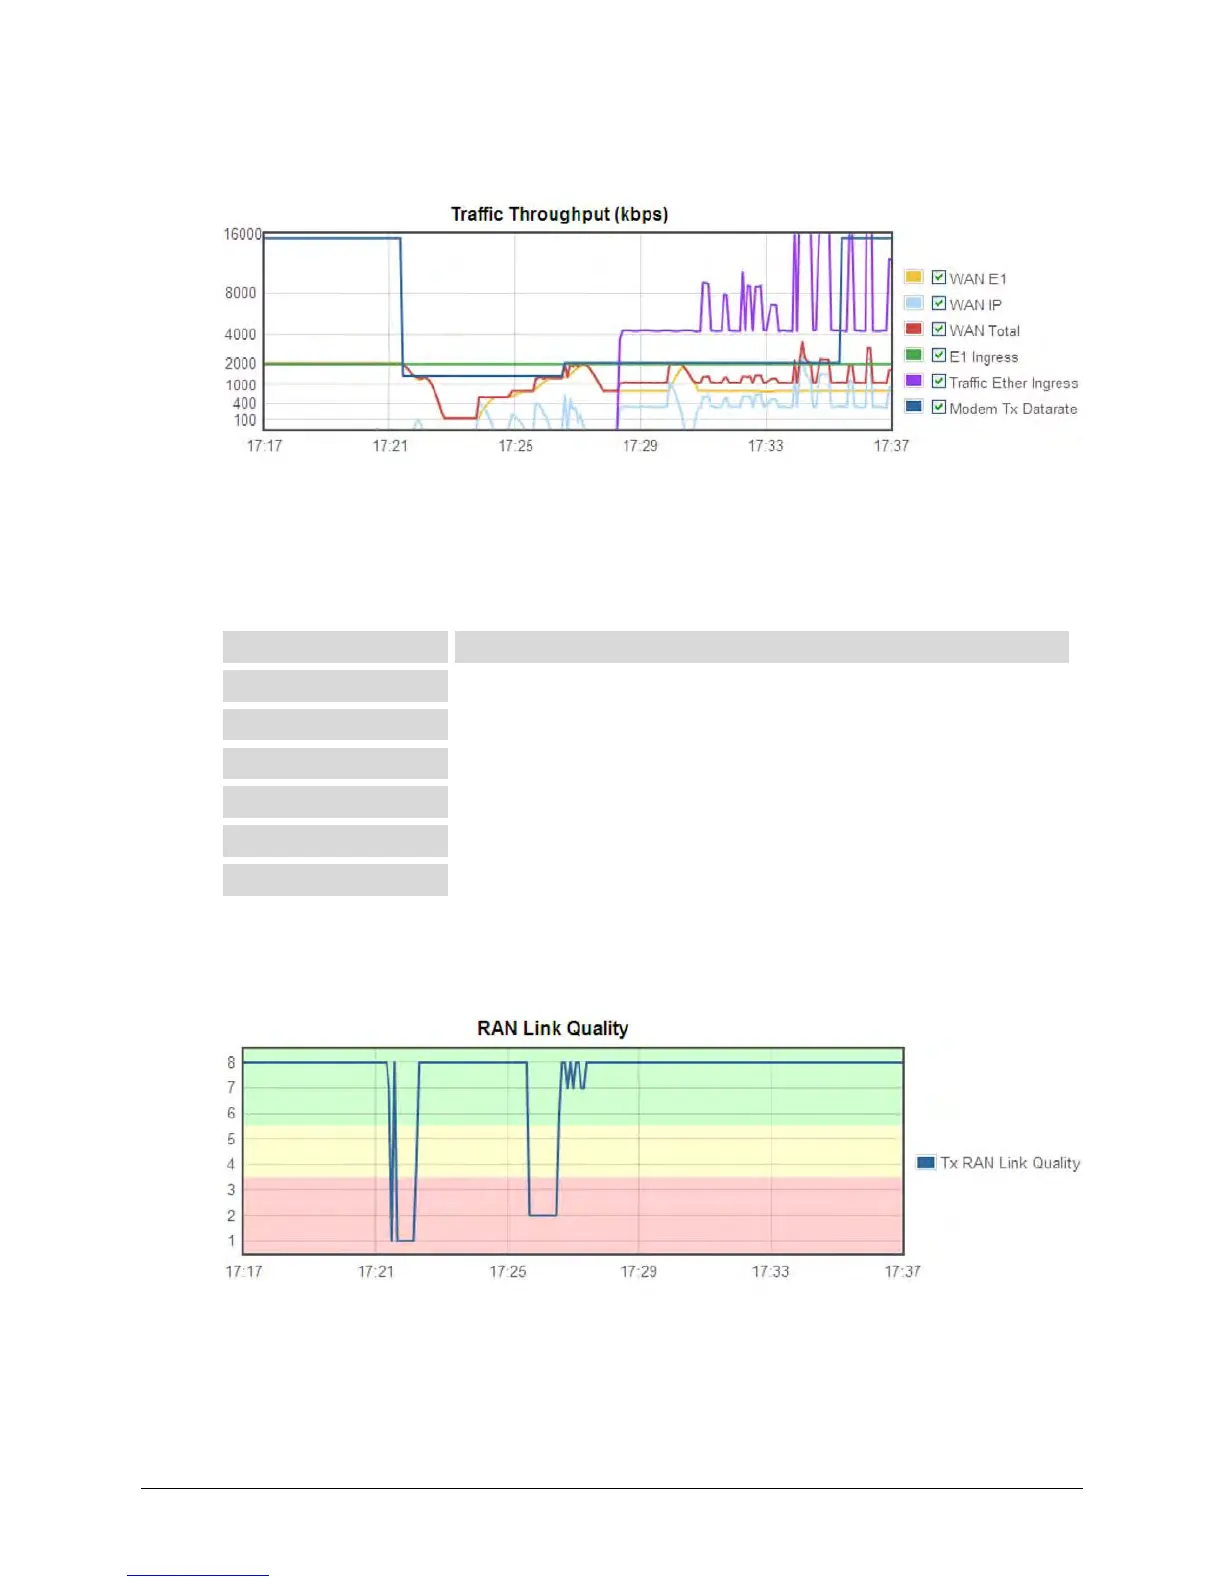
K.2.2.1.1 Traffic Throughput (kbps) Graph
This graph illustrates the utilization of all available data traffic types over the chosen time span.
This example shows the graph with the 20-minute time span selected.
Note the following:
WAN E1 WAN data rate associated with E1/RAN traffic
WAN data rate associated with IP traffic
WAN Total WAN data rate total (WAN E1 + WAN IP)
E1 Ingress Data rate of E1 time slots carried (64K * number of time slots)
Data rate of Ethernet traffic
Modem Tx Datarate Modem transmit data rate
K.2.2.1.2 RAN Link Quality Graph
This graph illustrates the performance indicator for the Tx RAN Link Quality metric, a qualitative
measure of the voice quality predicated by a) the level of compression, and b) voice packet
discard required to accommodate the incoming traffic into the available WAN (satellite)
bandwidth. This example shows the graph with the 20-minute time span selected.