CDM-570A/570AL Satellite Modem with Optional Packet Processor
Revision 5
Ethernet-based Remote Product Management 7–75 MN-CDM570A
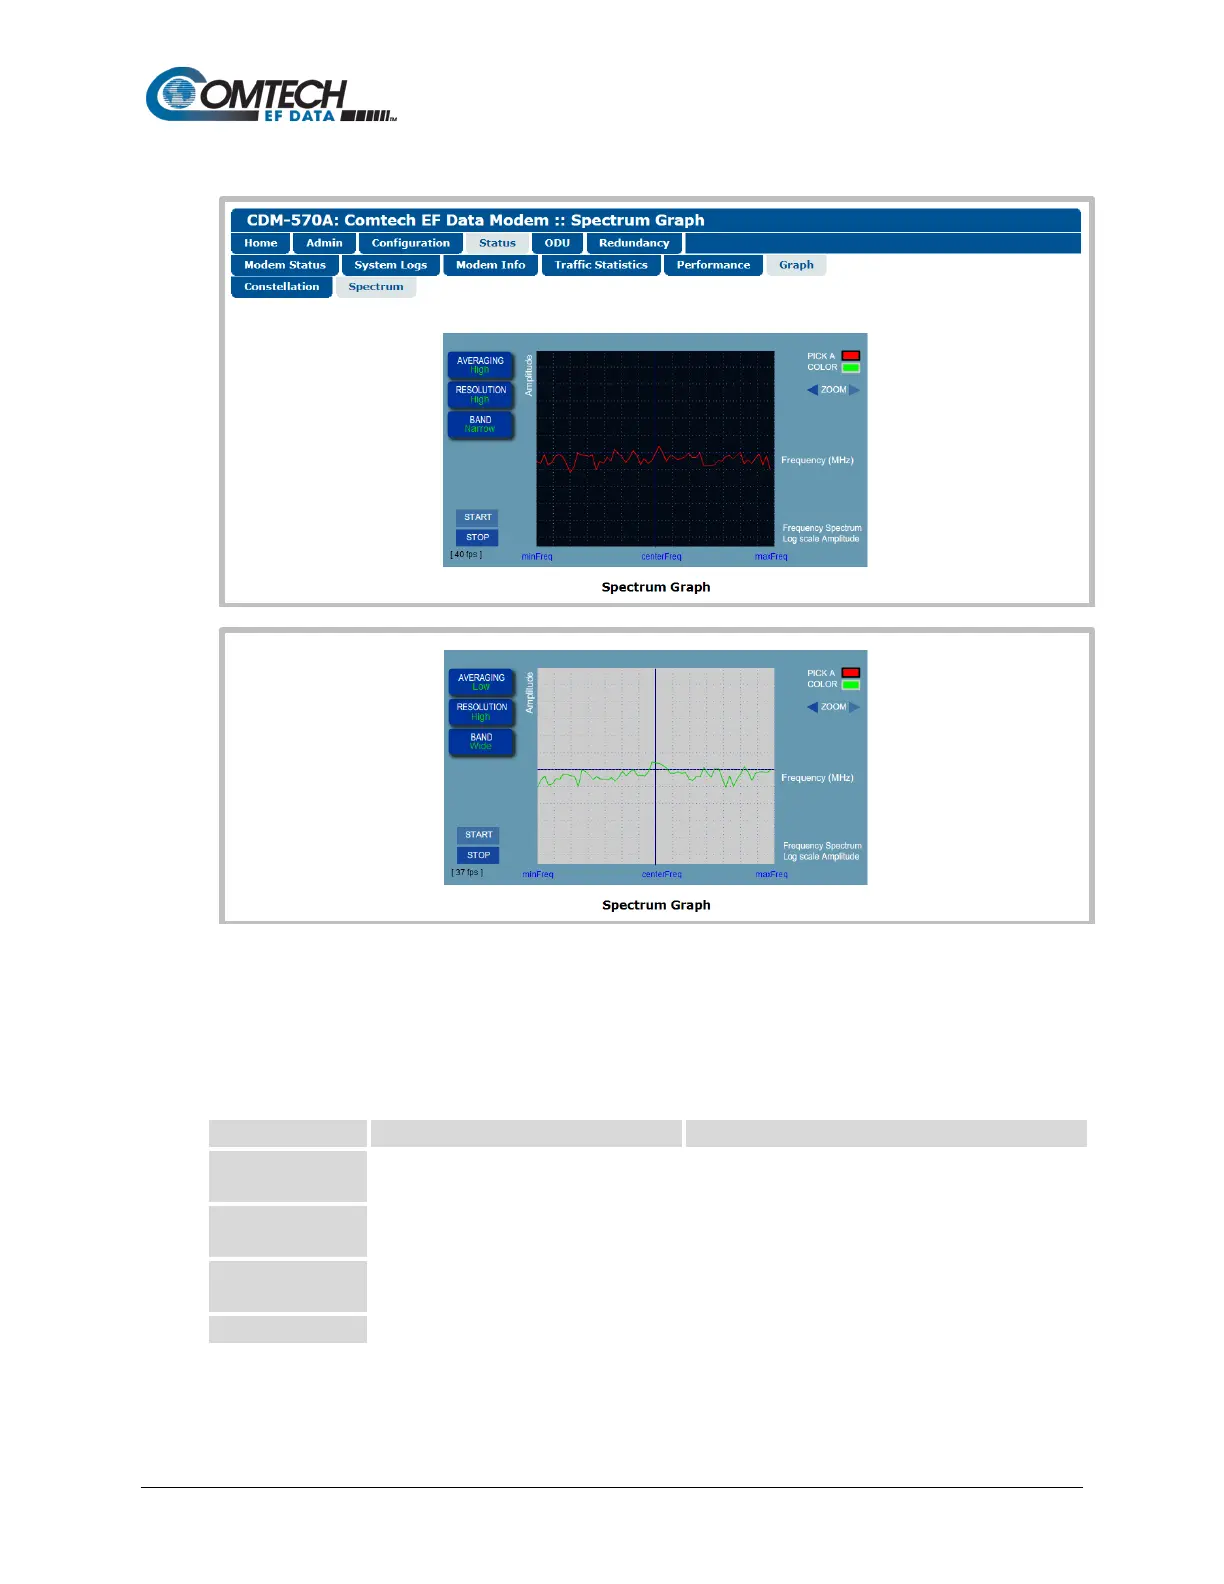
7.4.3.4.6.2 Status | Graph | Spectrum
(TOP) Spectrum Graph “PICK A COLOR” = (RED), AVERAGING=High,
RESOLUTION=High, BAND=Narrow
(BOTTOM) Spectrum Graph “PICK A COLOR” = (GREEN), AVERAGING=Low,
RESOLUTION=High, BAND=Wide
(Banner, Menu Bar not shown)
Figure 7-48. Status | Graphs | Spectrum Page
Use this page to display the real-time Spectrum Analyzer. Customize the display as follows:
Click RED or GREEN to define the
overall appearance of the graph.
• RED waveform on a BLACK/GRAY grid
• GREEN waveform on a GRAY/BLUE grid
Allows you to select the averaging of the
FFT spectrum.
Select Off, Low, Medium, or High
Allows you to adjust the output
resolution.
Select Low, Medium, or High
Allows you to select the bandwidth span.
Click [START] to activate or [STOP] to pause the Spectrum Analyzer function.