F R O N T C O N S O L E C H A P T E R 7
color of all the filter overlays can be changed independently using the Setup Form-Appearance
Tab.
The frequency scale shows the actual frequency (in MHz).
The edges of the amateur bands are marked as red vertical lines.
With the mouse, filters and filter edges can be varied by dragging and dropping
The Panadapter is useful because although you hear only the signals within the audio passband, you can see
in real time all signals within the receiver’s passband (as determined by the sound card’s sampling rate).
This gives a much more complete picture of the surrounding area in the band, especially when there is
abundant signal activity (e.g. contest and DX situations).
Histogram
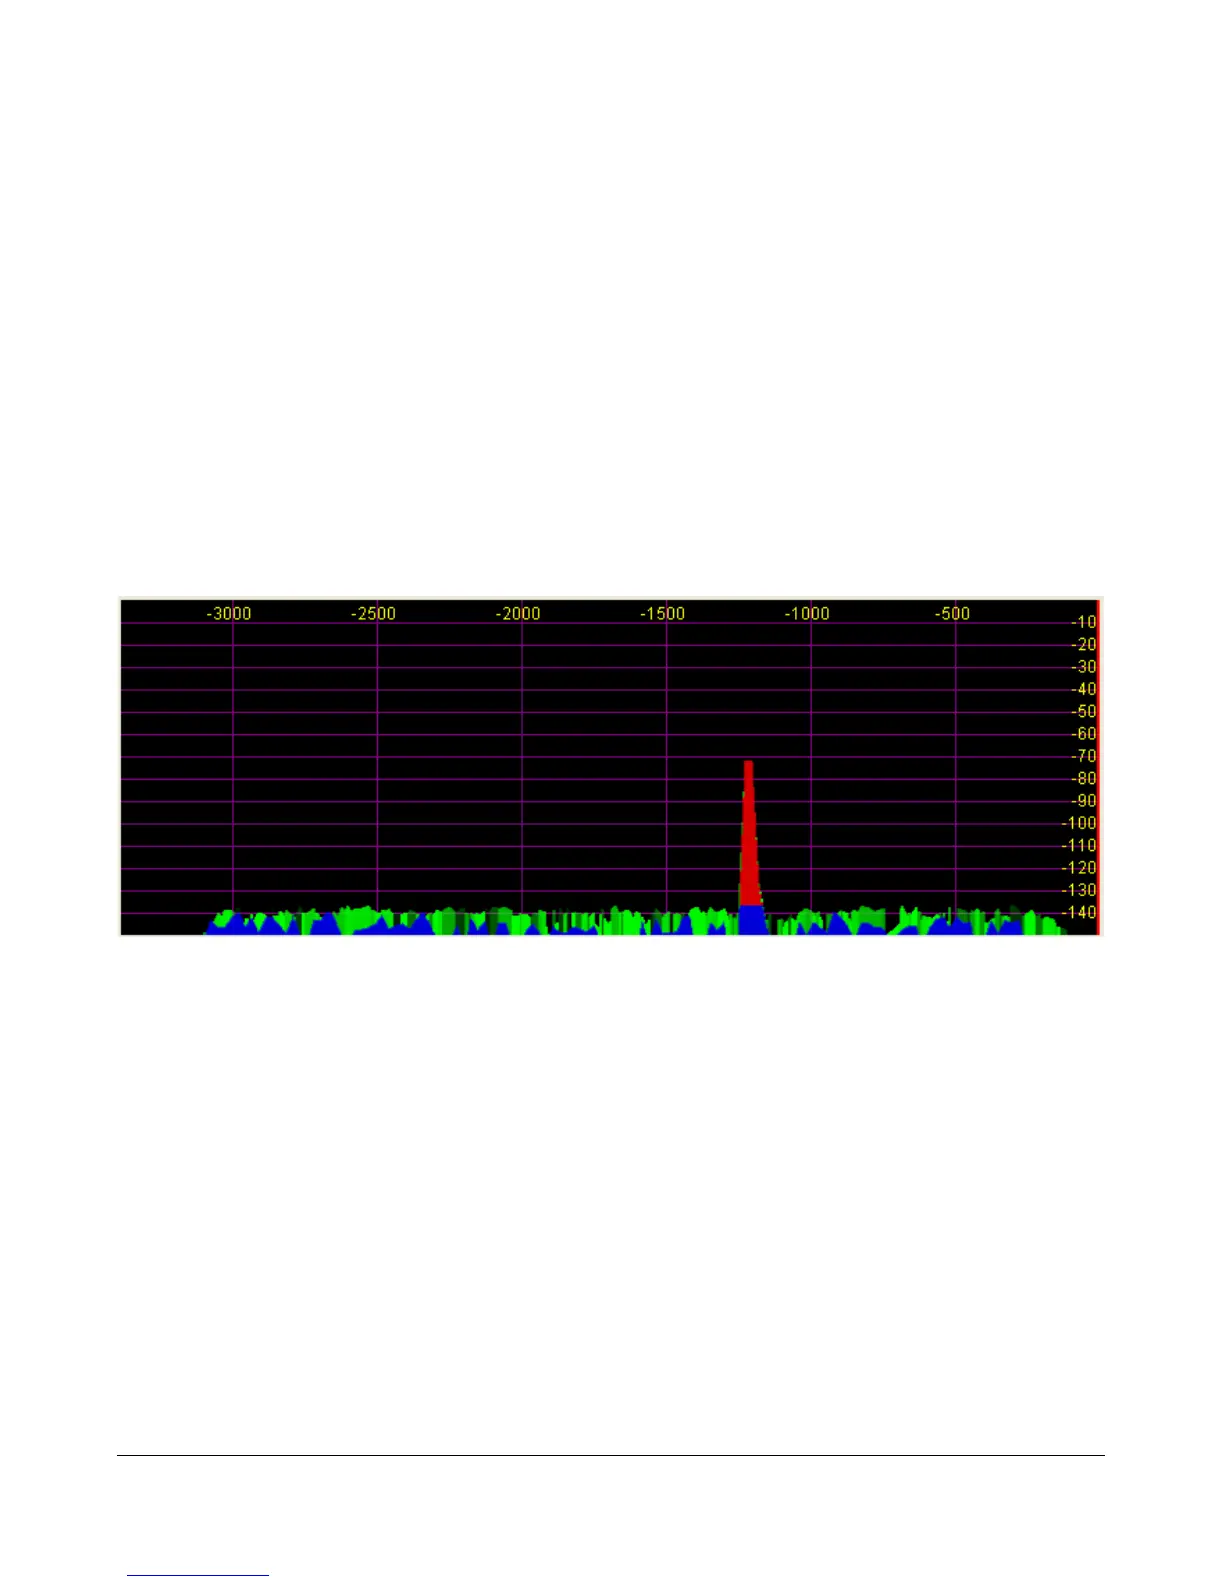
Figure 42: Histogram Display Mode
The Histogram Display is similar to the Spectrum Display, but instead of a single color data line, additional
colored data is used. Blue signals are real-time (current) signals that are below a signal threshold (roughly
below the average plus a small margin). The red signals are real-time (current) signals that are above that
same threshold. The green signals are previous peaks on that same frequency that will fade as time goes by
(a type of history, hence the name).
[The rest of this page has been left blank intentionally]
54 FlexRadio Systems