F R O N T C O N S O L E C H A P T E R 7
Cursor and Peak Position
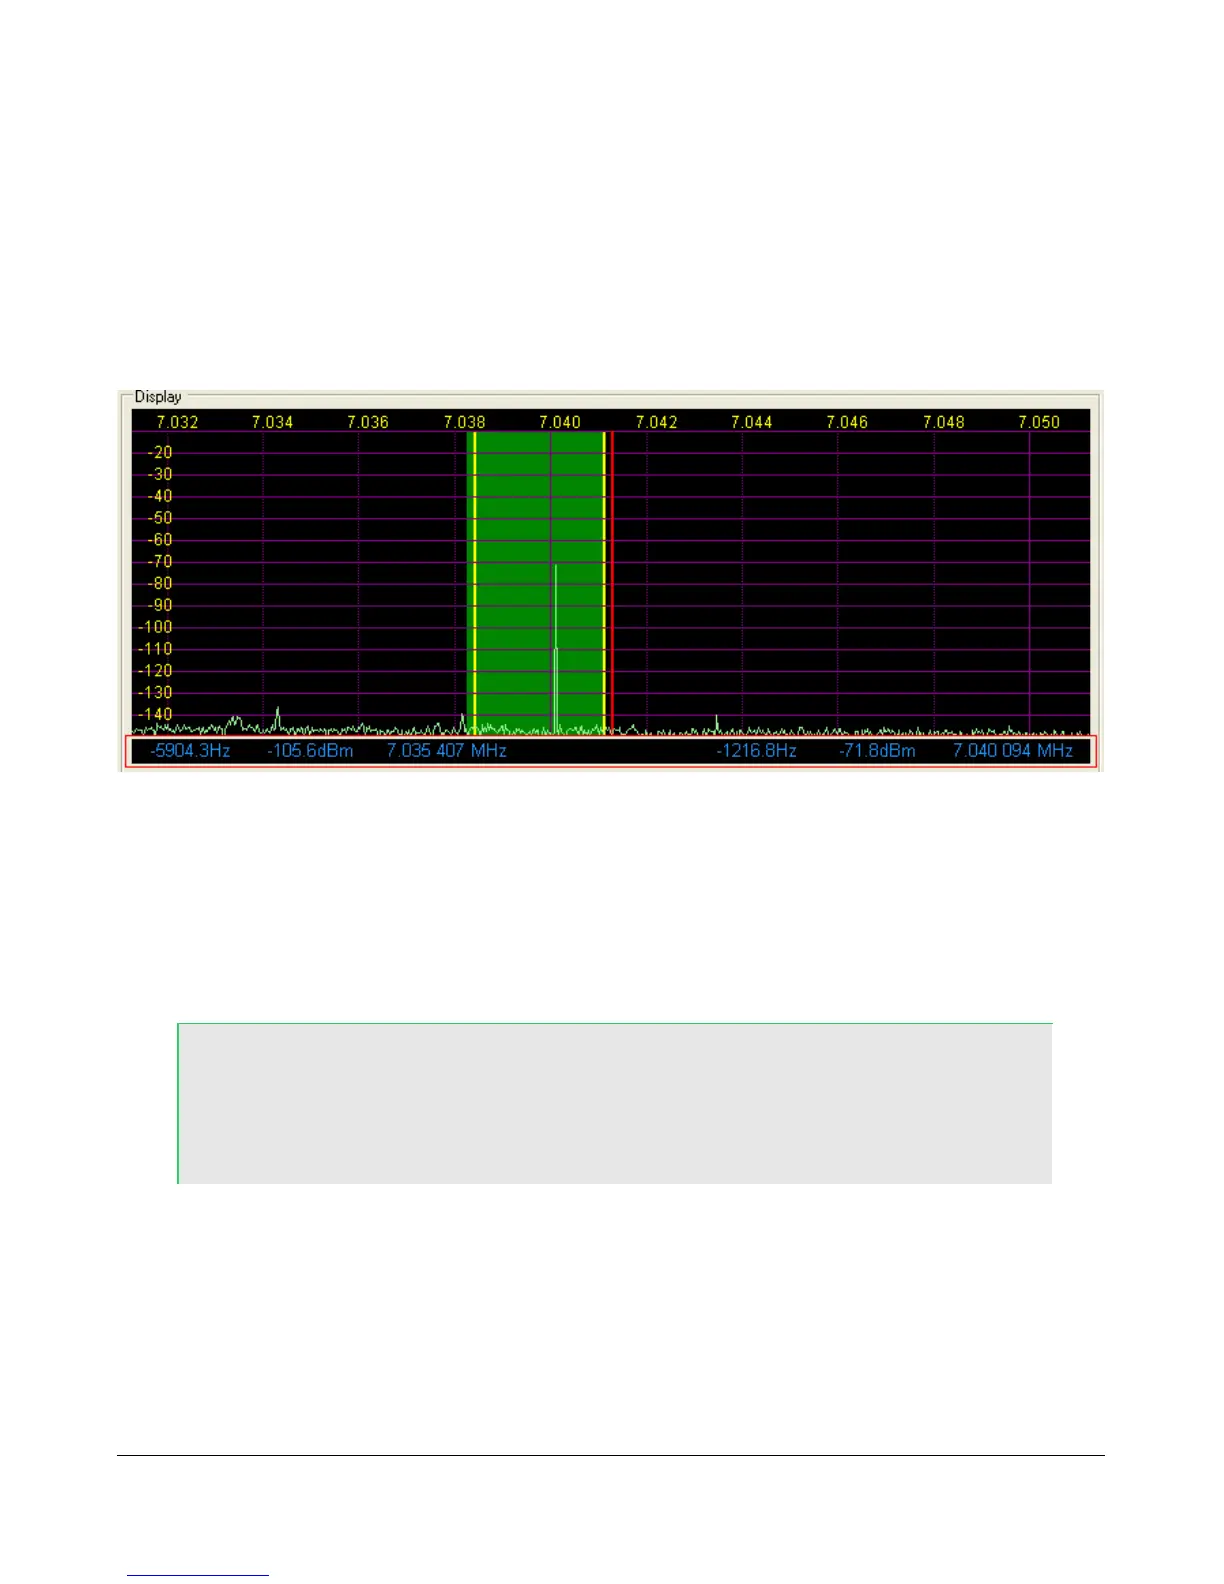
There are two sets of data side by side under the display that are used to communicate cursor (left) and peak
signal (right) information to the user. For each the data shown is Offset from VFO, Signal Level and
Frequency. For example, in the screenshot shown, the (peak) signal is 1216.8Hz offset from the VFO
frequency (7.0413MHz). The signal level is –71.8dBm, and the signal is at 7.040094MHz. Note that these
values are fairly low resolution due to the discrete nature of the pixel display.
Figure 46: Display Position Features
In the spectrum displays (Spectrum, Panadapter, Histogram, Waterfall), you can click the right mouse
button to bring up yellow crosshairs that span the width and height of the display. The crosshairs, along
with the AVG control, allow easy measurement of signals on the display. Another feature of the yellow
crosshairs is click tuning. Clicking the left mouse button with the yellow crosshairs tunes VFO A to the
frequency indicated by the cursor position data. This is an excellent way to tune CW signals as it will zero
beat the tone to the set CW pitch.
Hint: When either Split or Sub-RX is enabled clicking on the right mouse
button will cycle the crosshairs through yellow, red and none. When the
red crosshairs are showing, clicking the left mouse button will tune VFO
B.
[The rest of this page has been left blank intentionally]
57 FlexRadio Systems