F R O N T C O N S O L E C H A P T E R 7
Spectrum
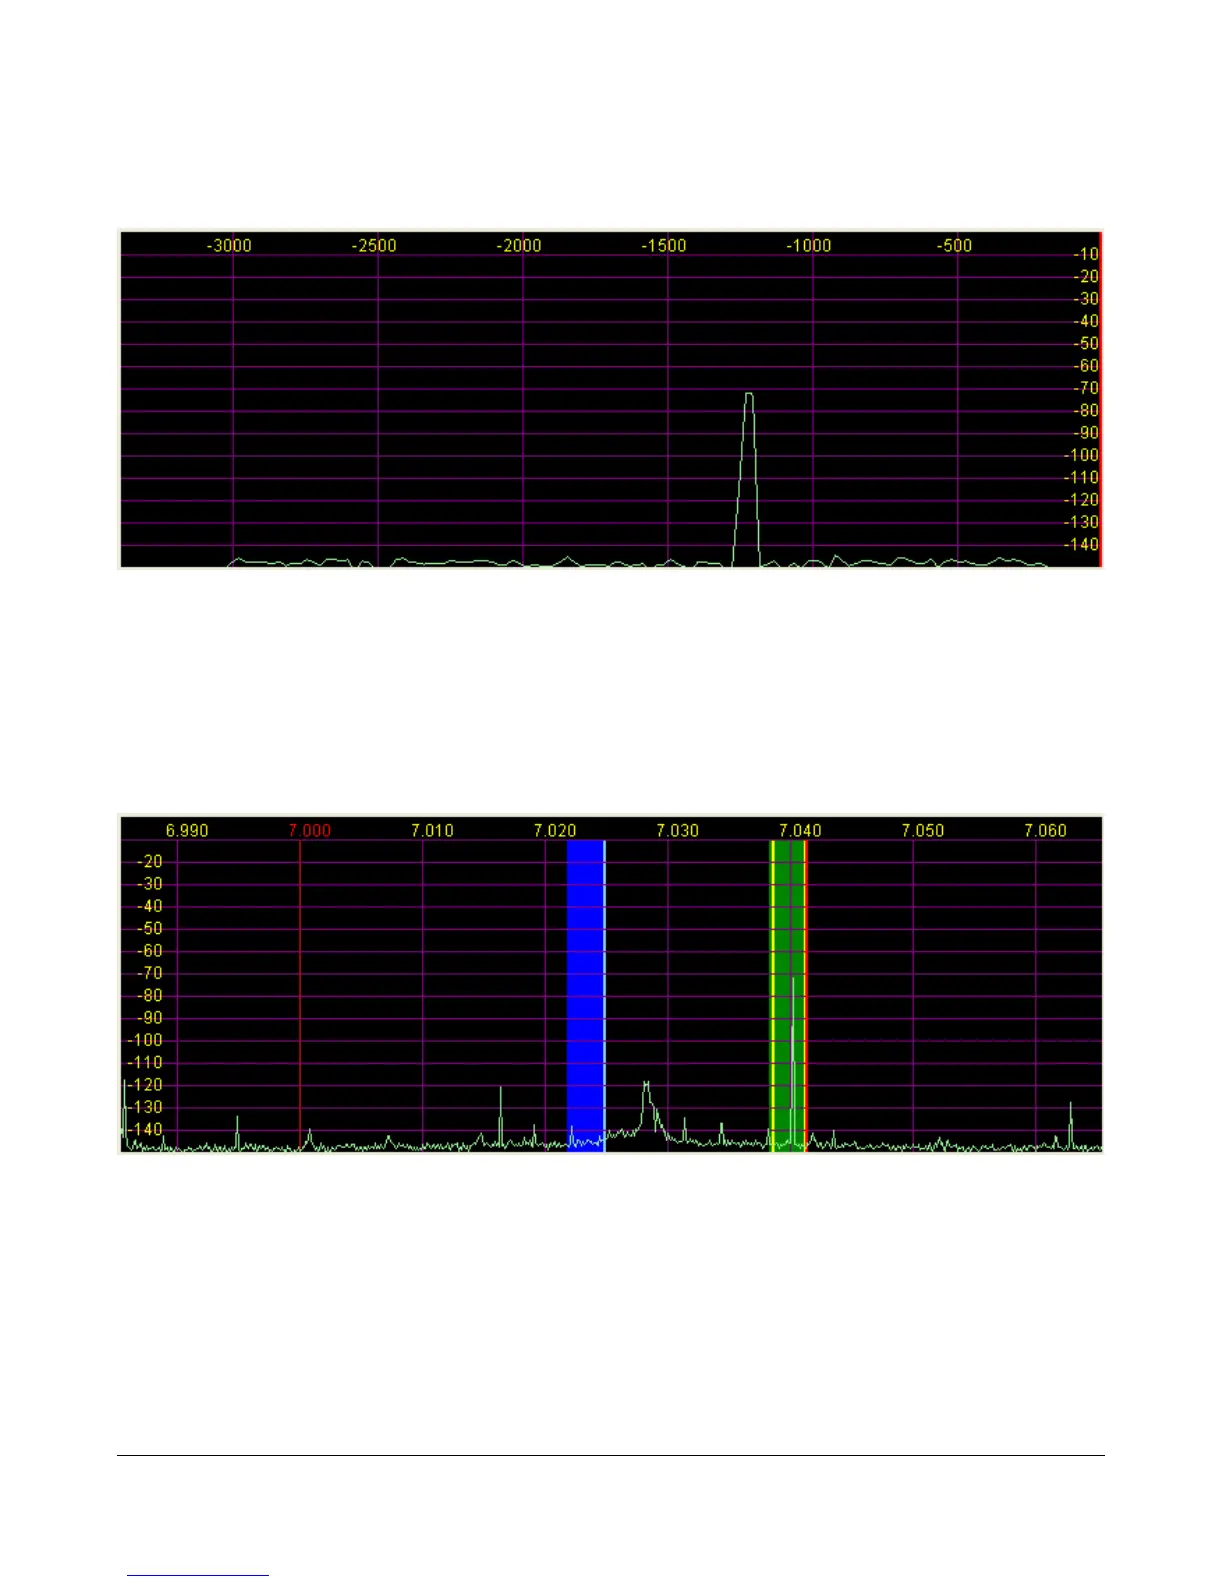
Figure 40: Spectrum Display
The Spectrum Display shows a classical spectral view of the frequency with the ends of the display
determined by the bandwidth of the filter. The scale across the top shows the frequency offset in Hz from
the VFO A frequency. Rather than only using half the display window when in lower or upper sideband, we
expand the display moving the 0Hz line to the left or right margin (LSB mode with a 2.9kHz filter shown).
Panadapter (Panoramic Adapter)
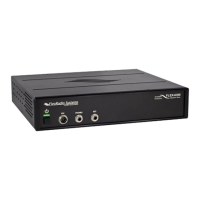
Figure 41 Panadapter Display
The Panadapter Display is similar to the Spectrum Display with several differences.
The maximum display width is a function of the selected sound card sampling rate, no matter what
filter bandwidth is selected.
The selected filter is displayed as an overlay to help the user visualize the filter. Shown are the
Main RX filter (green), the Sub-RX filter (blue) and the TX filter edges (yellow vertical lines). The
53 FlexRadio Systems