S E T U P F O R M C H A P T E R 8
Spectrum Grid
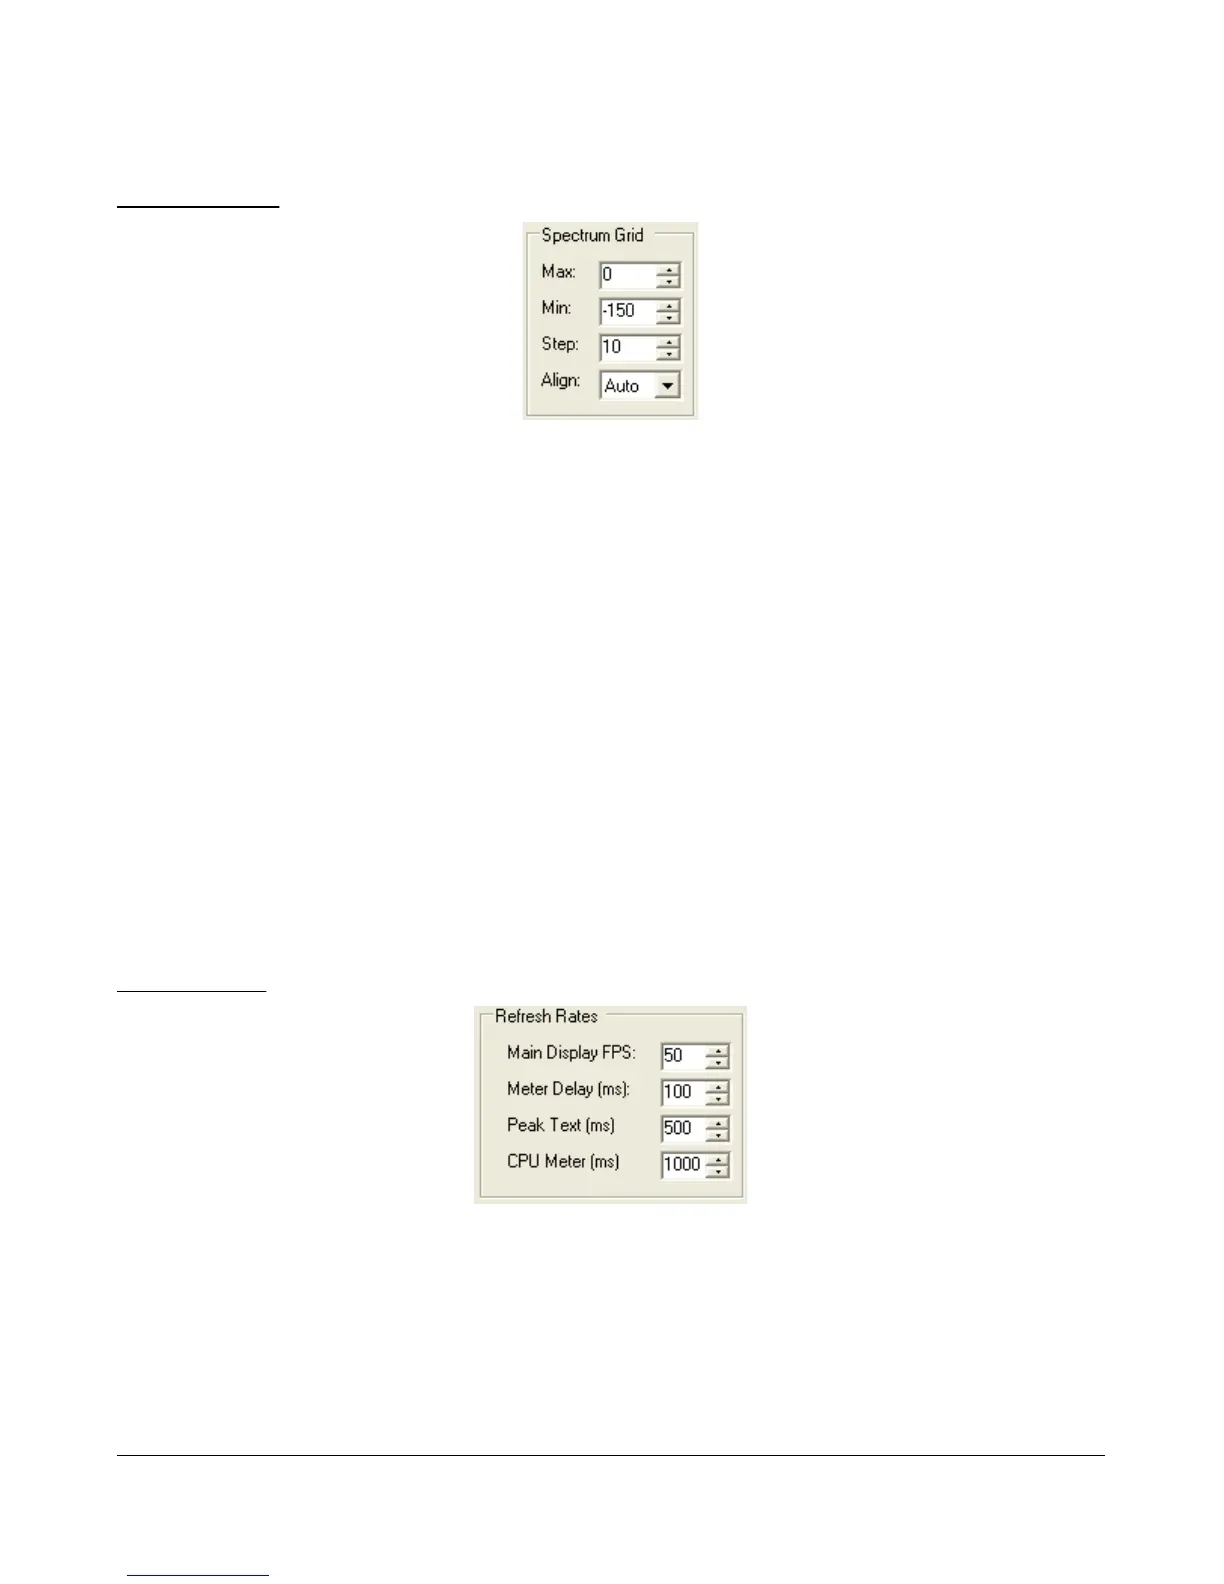
Figure 73: Spectrum Grid
The spectrum grid controls define the background grid shown in the Spectrum, Histogram, and Panadapter
displays.
Max: The maximum signal shown on the spectrum displays in dBm (i.e. top of the display).
Raising this value will expand the limits of the display while compressing the range shown.
Min: The minimum signal shown on the spectrum display in dBm (i.e. bottom of the display).
Similar to the max setting, lowering this value will expand the limits of the display while
compressing the range shown.
Step: Spacing between vertical power spectra gridlines in dBm. This control can be used to spread
the horizontal lines and vertical axis values on the display, which some people may find distracting.
Use the Align control to turn them off completely.
Align: Sets the position of the vertical axis. The Left, Center, Right, and Off settings are self-
explanatory. The Auto option works based on the filter selection and operates as it did in previous
PowerSDR versions.
Refresh Rates
Figure 74: Refresh Rates
Main Display FPS: Sets the update rate of the main display to the selected value in frames per
second. Note that this is a good control to reduce if you are running on a slower machine to save
CPU cycles. Raising this value will give faster updates at the cost of CPU load. Lowering the value
will slow the display down.
81 FlexRadio Systems
 Loading...