F R O N T C O N S O L E C H A P T E R 7
Waterfall
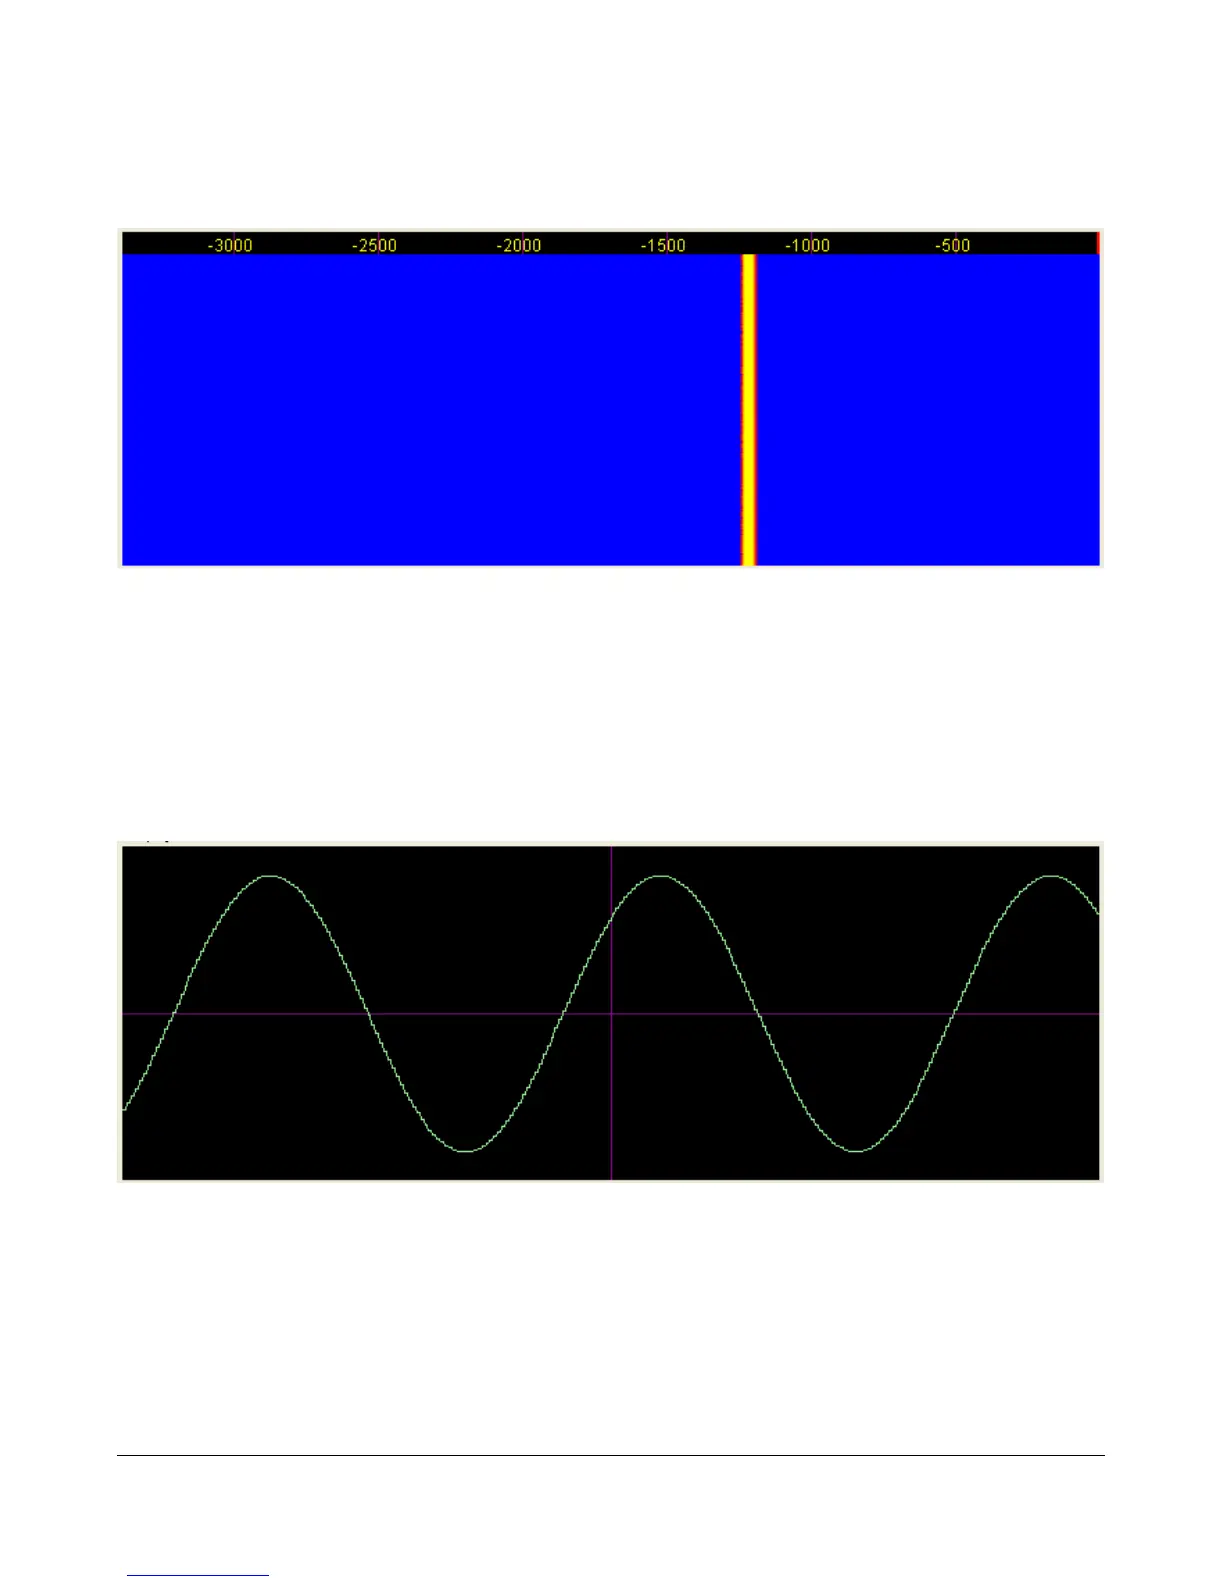
Figure 43: Waterfall Display
The Waterfall Display shows a scrolling view of activity within the passband. This makes tracking narrow
band signals much easier and can even allow visualization of CW signals at slower speeds (longer line is a
dash, short line is a dot, no line is a pause). The Waterfall Display can be customized on the Setup Form-
Display Tab This allows custom setting of the dynamic range and coloring for the display. (See the Setup
Form-Display Tab in the next chapter for more details.)
Scope
Figure 44: Scope Display
The Scope Display shows a single channel in the time domain. In essence this is a traditional waveform
view of the input data. Shown is effectively a 1kHz tone (tuned to 7.0411MHz with the signal at
7.0401MHz). The Scope Display is particularly useful when transmitting to monitor your transmitted
waveform. The time base can be adjusted on the Setup Form- Display Tab.
55 FlexRadio Systems