162 Chapter 7
Setting Up the Display of Measurement Results
Selecting the Graph Axis Format
When Using Complex Parameters (COMPLEX Z-Y)
When the Agilent 4294A is configured to perform a COMPLEX Z-Y measurement
(complex impedance for Trace A, complex admittance for Trace B), use the following
procedure to select the graph axis formats:
Step 1. Activate the trace for which you want to set the axis format.
Step 2. Press the
[Format] key to display the Format menu.
Step 3. Select the desired graph axis format by pressing the appropriate key:
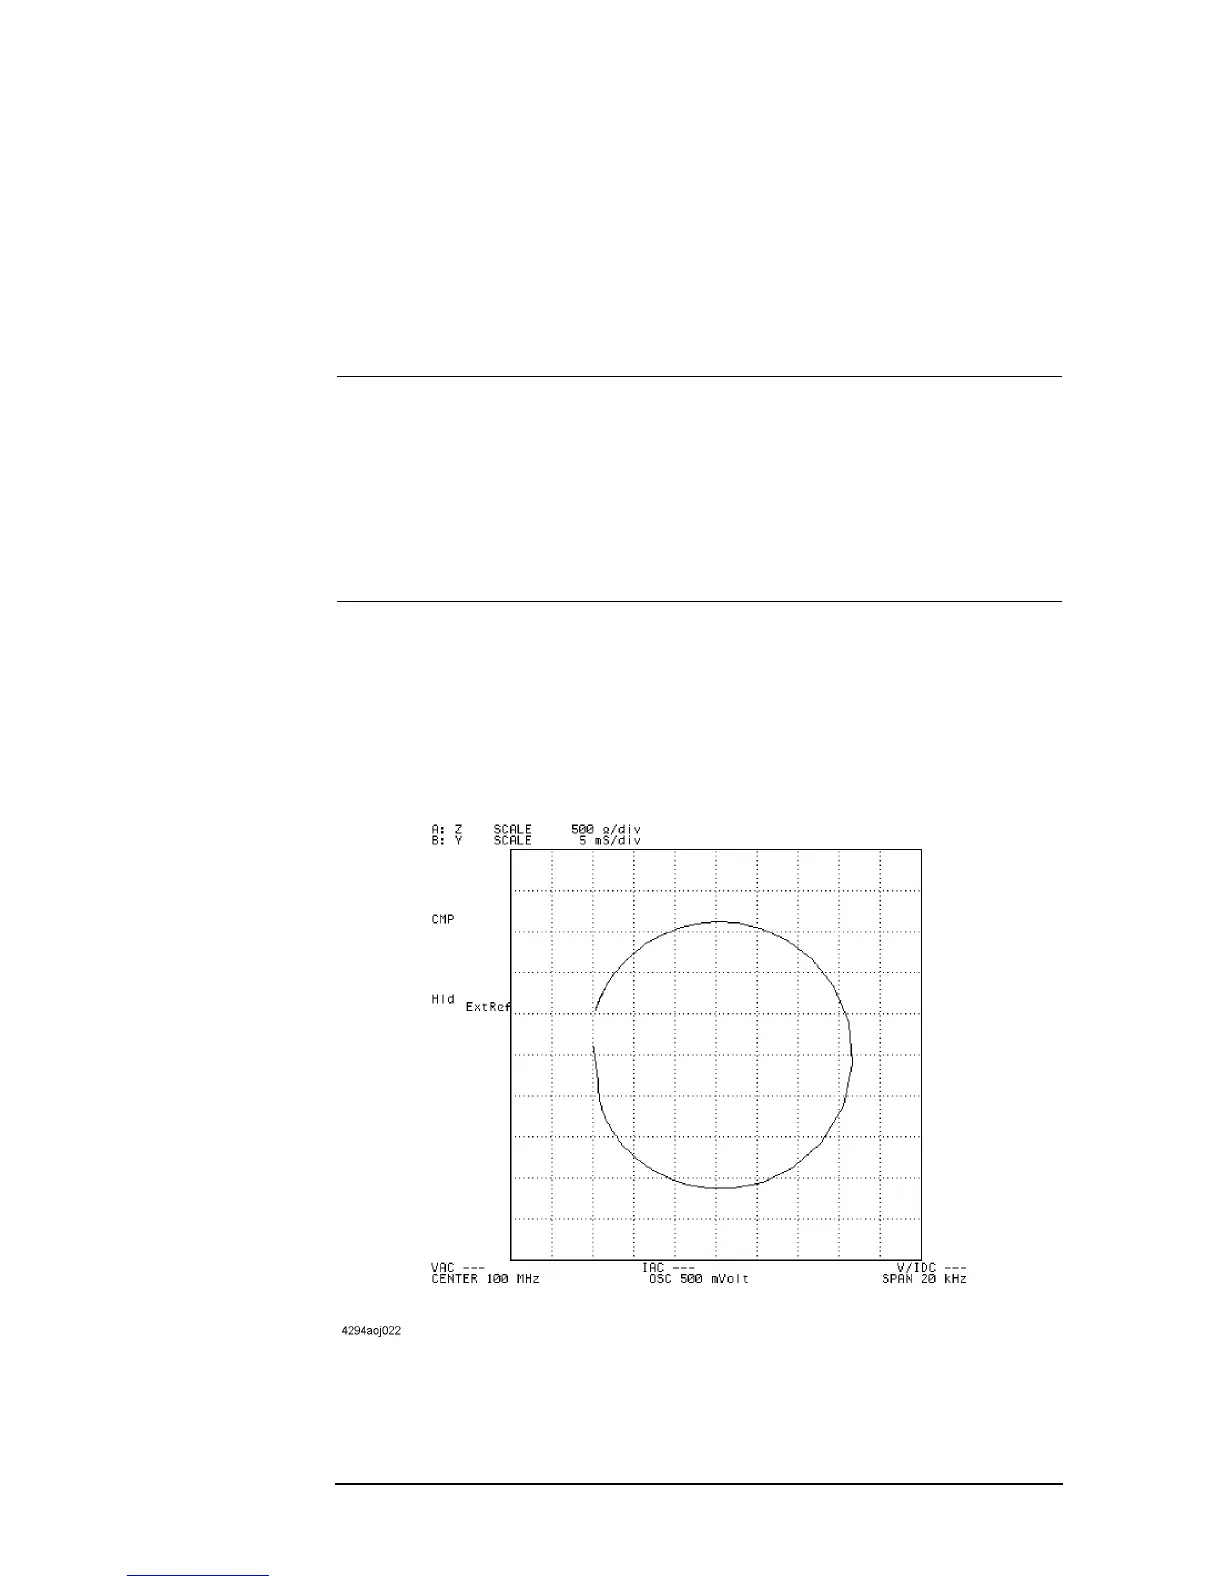
Figure 7-3 Complex plane whose Y axis indicates complex admittance (with only Trace B
displayed)
To activate: Press:
Trace A
[A]
Trace B [B]
To sele ct: Press :
Complex plane (where the horizontal and
vertical axes use real and complex values,
respectively)
COMPLEX
Polar chart POLAR