186 Chapter 7
Setting Up the Display of Measurement Results
Superimposing Multiple Traces
positions on the screen.
Once you have turned on or off the trace superimpose feature, that setting is applied to both
Traces A and B.
Comparing traces using the list sweep function
The list sweep in the Agilent 4294A sweeps multiple frequency sweep ranges (segments)
under different conditions at one time. In the list sweep, by specifying the same sweep
range for each segment to be set and setting the horizontal axis of the graph to a single span
(common frequency axis), you can compare the measurement results under different
measurement conditions specified for each segment (oscillator level, dc bias level, and so
on) on the screen. For the list sweep, you can specify the pen number used to draw the trace
for each segment in order to color-code traces for easy comparison.
Step 1. Follow the procedures described in “Preparing list sweep table” on page 118 to create the
list sweep table, specifying each trace you want to compare as one segment. For this
operation, you should:
• Specify the same sweep range for all segments.
• Specify the same values for all parameters except for the parameter you want to vary
for comparison.
• Assign a different pen number to each segment to vary the colors of the traces.
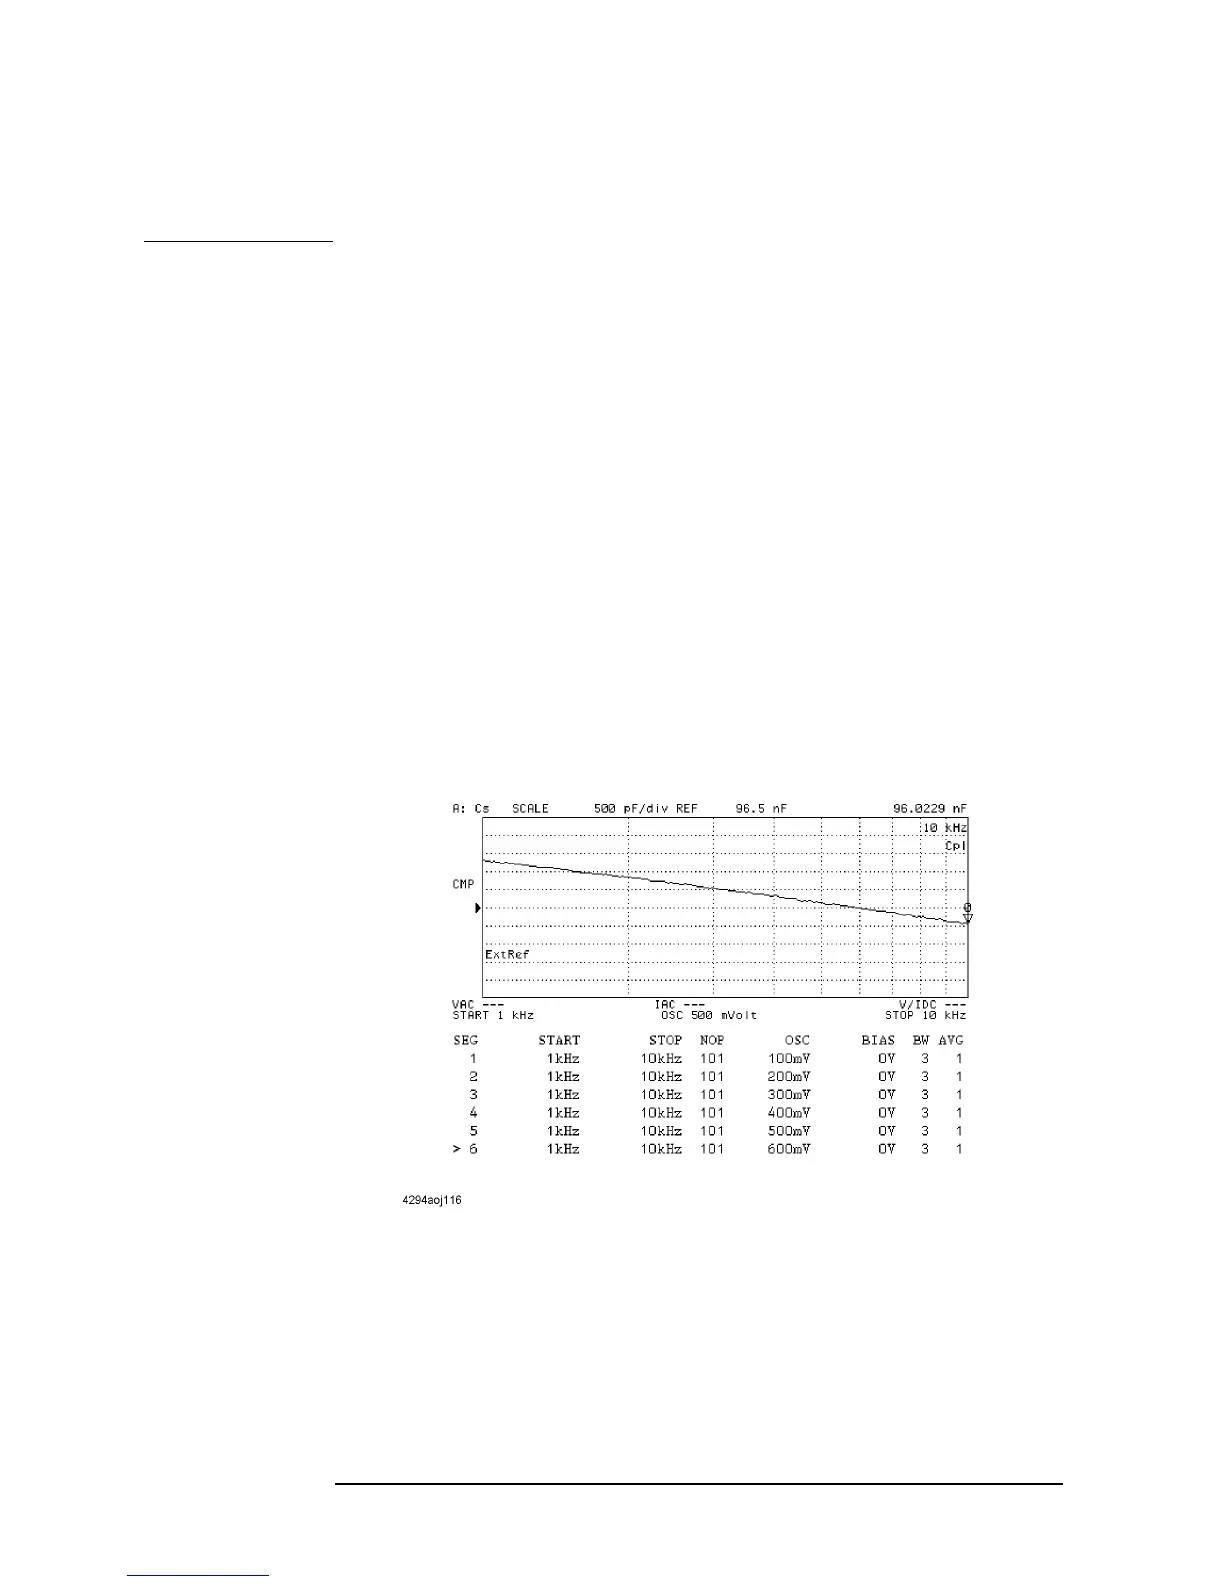
Figure 7-22 Example of creating a list sweep table to compare traces
Step 2. Follow the procedures described in “Selecting the list sweep as the sweep type” on page
124 to set the sweep type to the list sweep.
Step 3. Follow the procedures described in “Setting the Horizontal Axis of the Graph for the List
Sweep” on page 124 to set the horizontal axis of the graph. To compare traces using the
list sweep, set the horizontal axis of the graph to the single span (common frequency axis).