Chapter 7 169
Setting Up the Display of Measurement Results
Manual Scale Setting (for measurements other than COMPLEX Z-Y)
7. Setting Up the Display of
Measurement Results
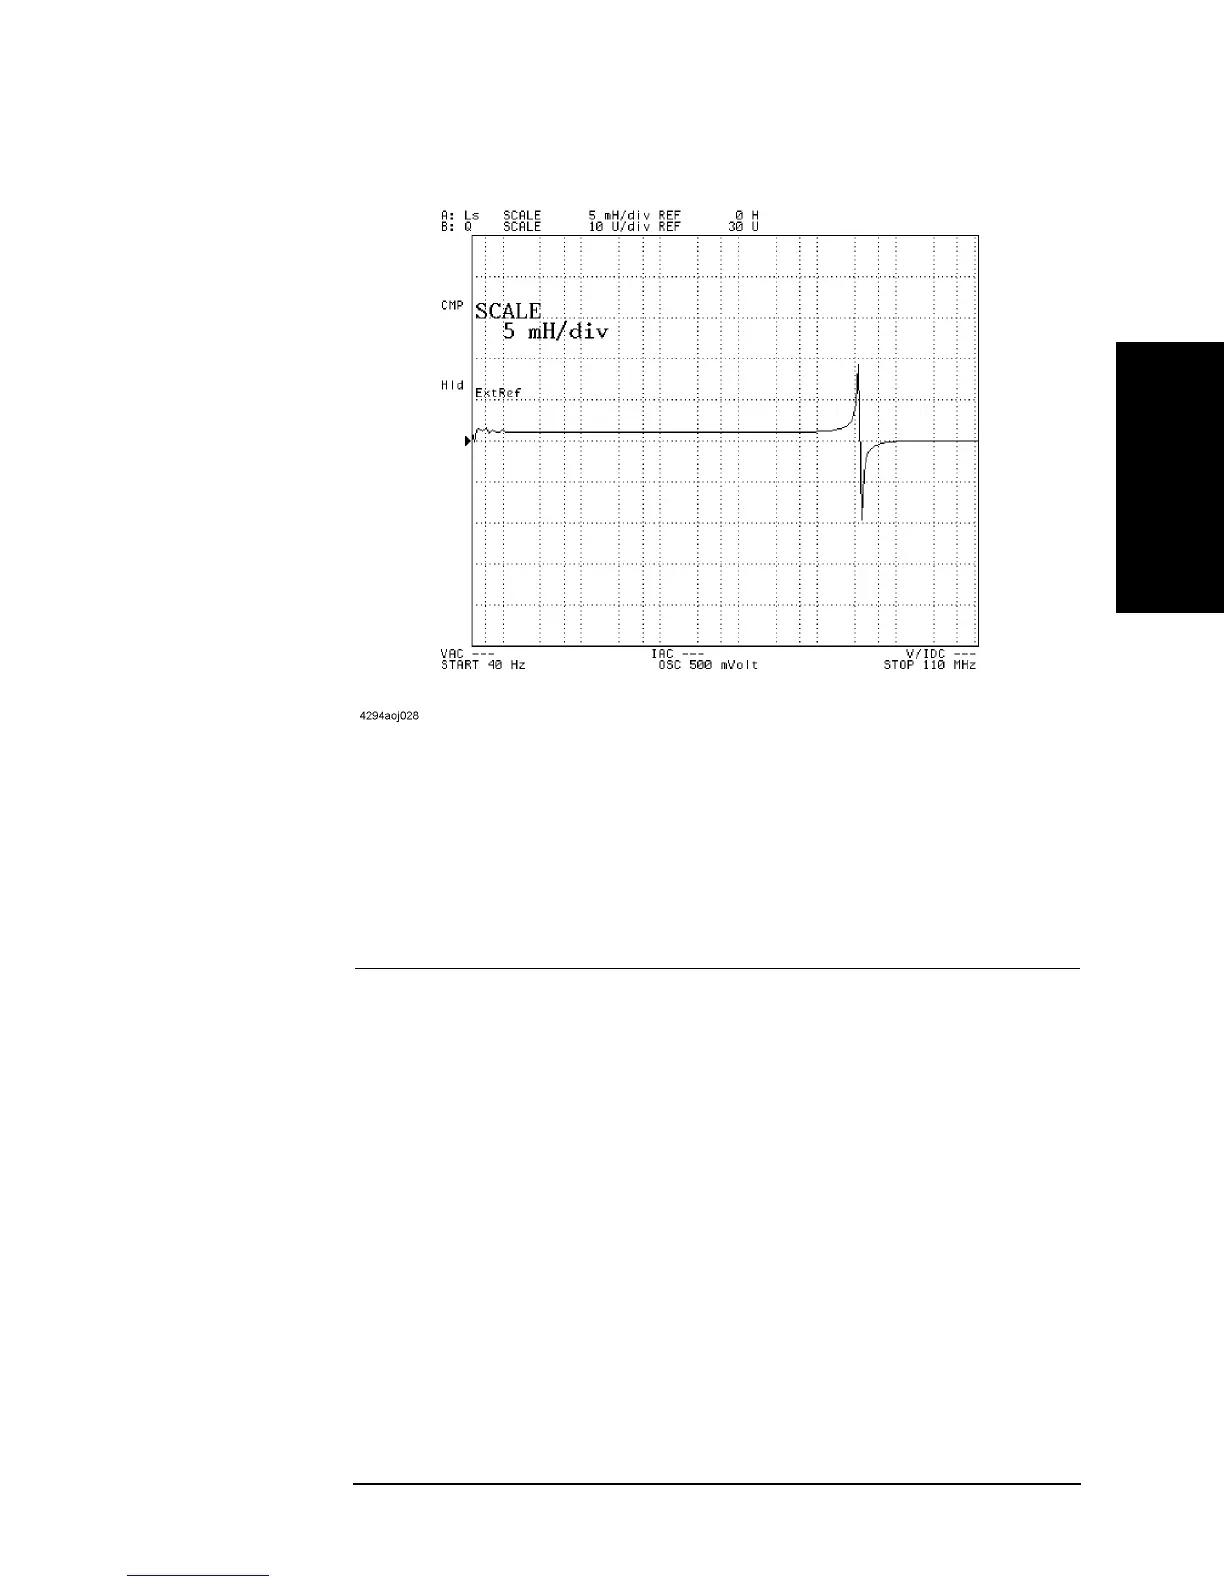
Figure 7-9 Setting the scale per division
Scaling the Trace Based on the Top and Bottom Values
Whether the vertical axis is linear or logarithmic, you can scale the trace by specifying the
highest (top) and lowest (bottom) values displayed within the graph.
Step 1. Activate the trace you want to manually scale.
Step 2. Press the
[Scale Ref] key to display the Scale Reference menu.
Step 3. Press the TOP VALUE key. The Parameter Setting field in the upper left area of the screen
indicates the top value currently in effect, that is, the value that corresponds to the line
displayed at the top of the graph.
Step 4. Use the keys or rotary knob of the ENTRY block in one of the following ways to specify
the top value.
• Enter the desired value with the numeric keys (
[0] to [9] and [.]) and then press one of
the unit keys (
[G/n], [M/m], [k/m], or [´1]).
• Turn the rotary knob (m
mm
m) until the desired value is set.
• Press the step keys ([][¯]) to set the desired value.
To activate: Press:
Trace A
[A]
Trace B [B]